

Redesigning 7 Healthcare Apps For an Intuitive & Improved Experience
Redesigning 7 Healthcare Apps For an Intuitive & Improved Experience
Redesigning 7 Healthcare Apps For an Intuitive & Improved Experience
About Project
About Project
About Project
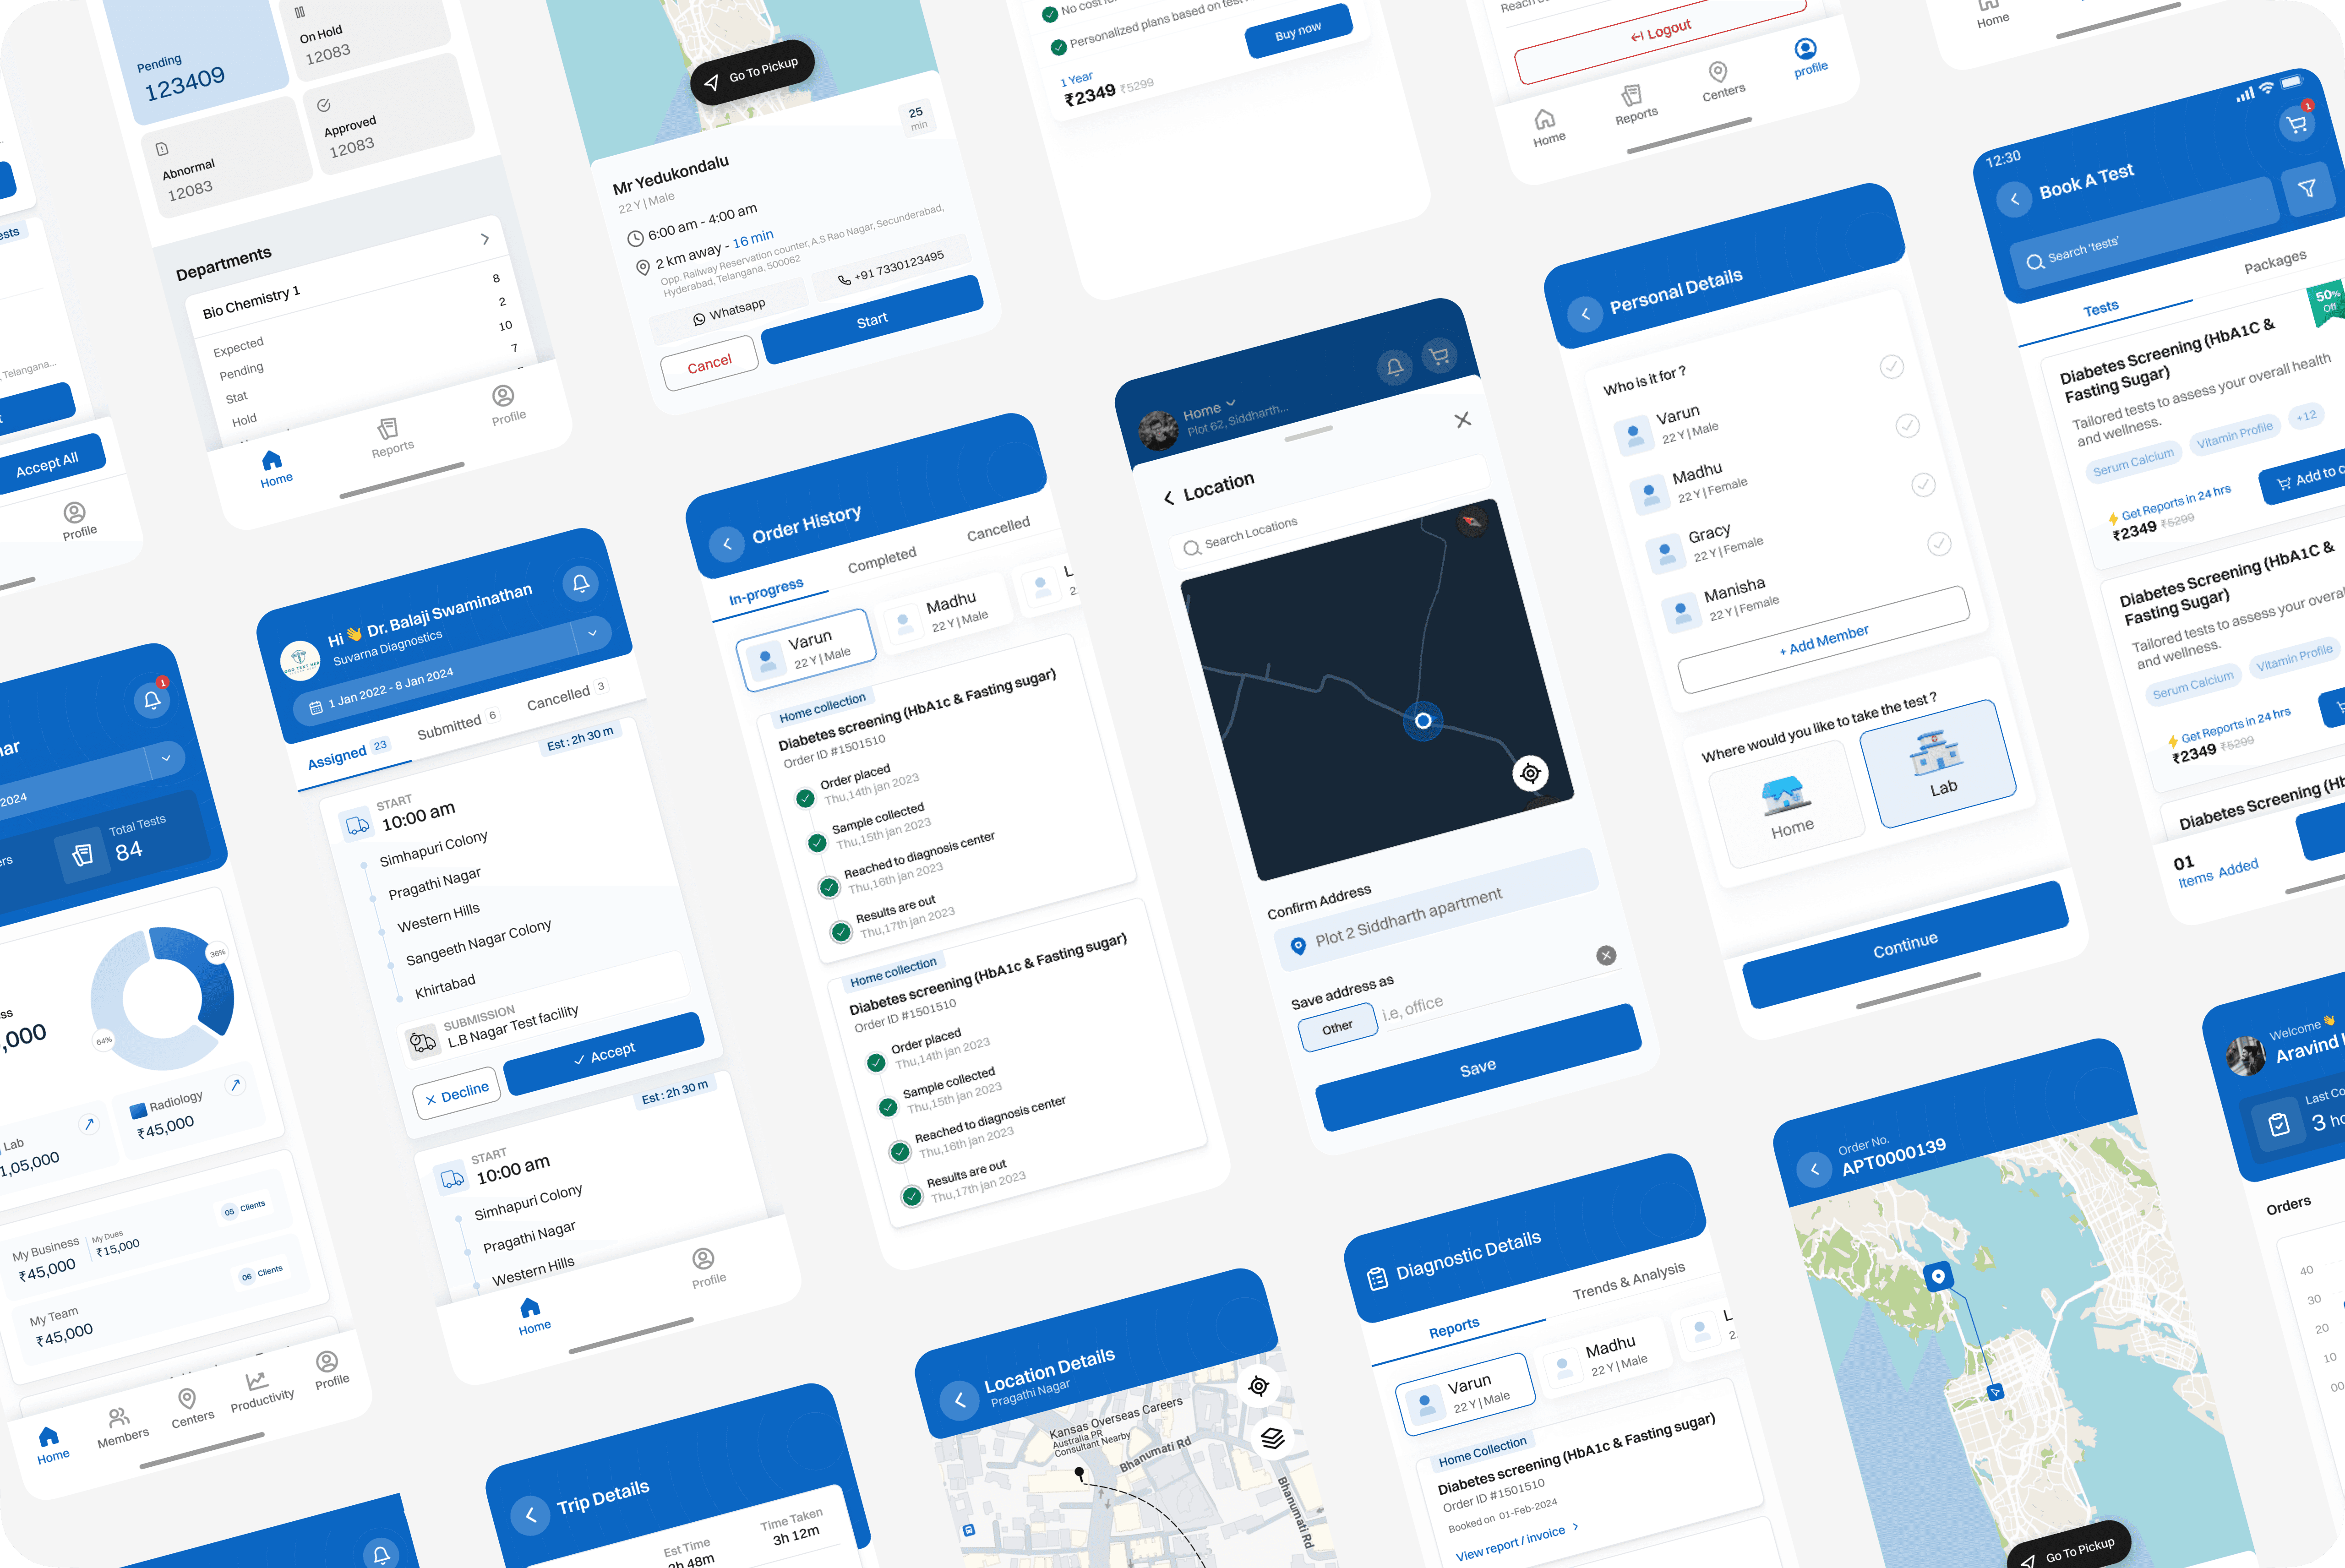
Suvarna operates a suite of seven mobile applications designed to support different stages of the diagnostic journey, including test booking, sample collection, logistics, reporting, and sales operations.
For nearly 6 years, Suvarna’s seven mobile apps remained largely unused. Each app suffered from poor usability, confusing workflows, and inconsistent interactions—leaving both customers and Suvarna’s internal teams frustrated and unable to rely on the tools meant to support their daily operations.
When Suvarna approached us, their biggest question was why the apps weren’t being adopted at all. Our detailed UX audit uncovered critical gaps in navigation, clarity, task flows, and role alignment. This formed the foundation for redesigning all seven apps into intuitive, dependable, high-adoption Software's that users could finally understand and trust.
About Project
Health Care
Team
Varun kashetty, S.Madhumala
Subscription Category
Quick win
Project start Year
December 2024
Business Challenges
Business Challenges
Business Challenges
Low Retention Across Modules
Low Retention Across Modules
Low Retention Across Modules
Inconsistent patterns and unclear steps reduced visibility, leading to abandoned workflows, user frustration, and very low module adoption.
Inconsistent patterns and unclear steps reduced visibility, leading to abandoned workflows, user frustration, and very low module adoption.
Inconsistent patterns and unclear steps reduced visibility, leading to abandoned workflows, user frustration, and very low module adoption.
Stuck in a Loop, Growth Stagnation
Stuck in a Loop, Growth Stagnation
Stuck in a Loop, Growth Stagnation
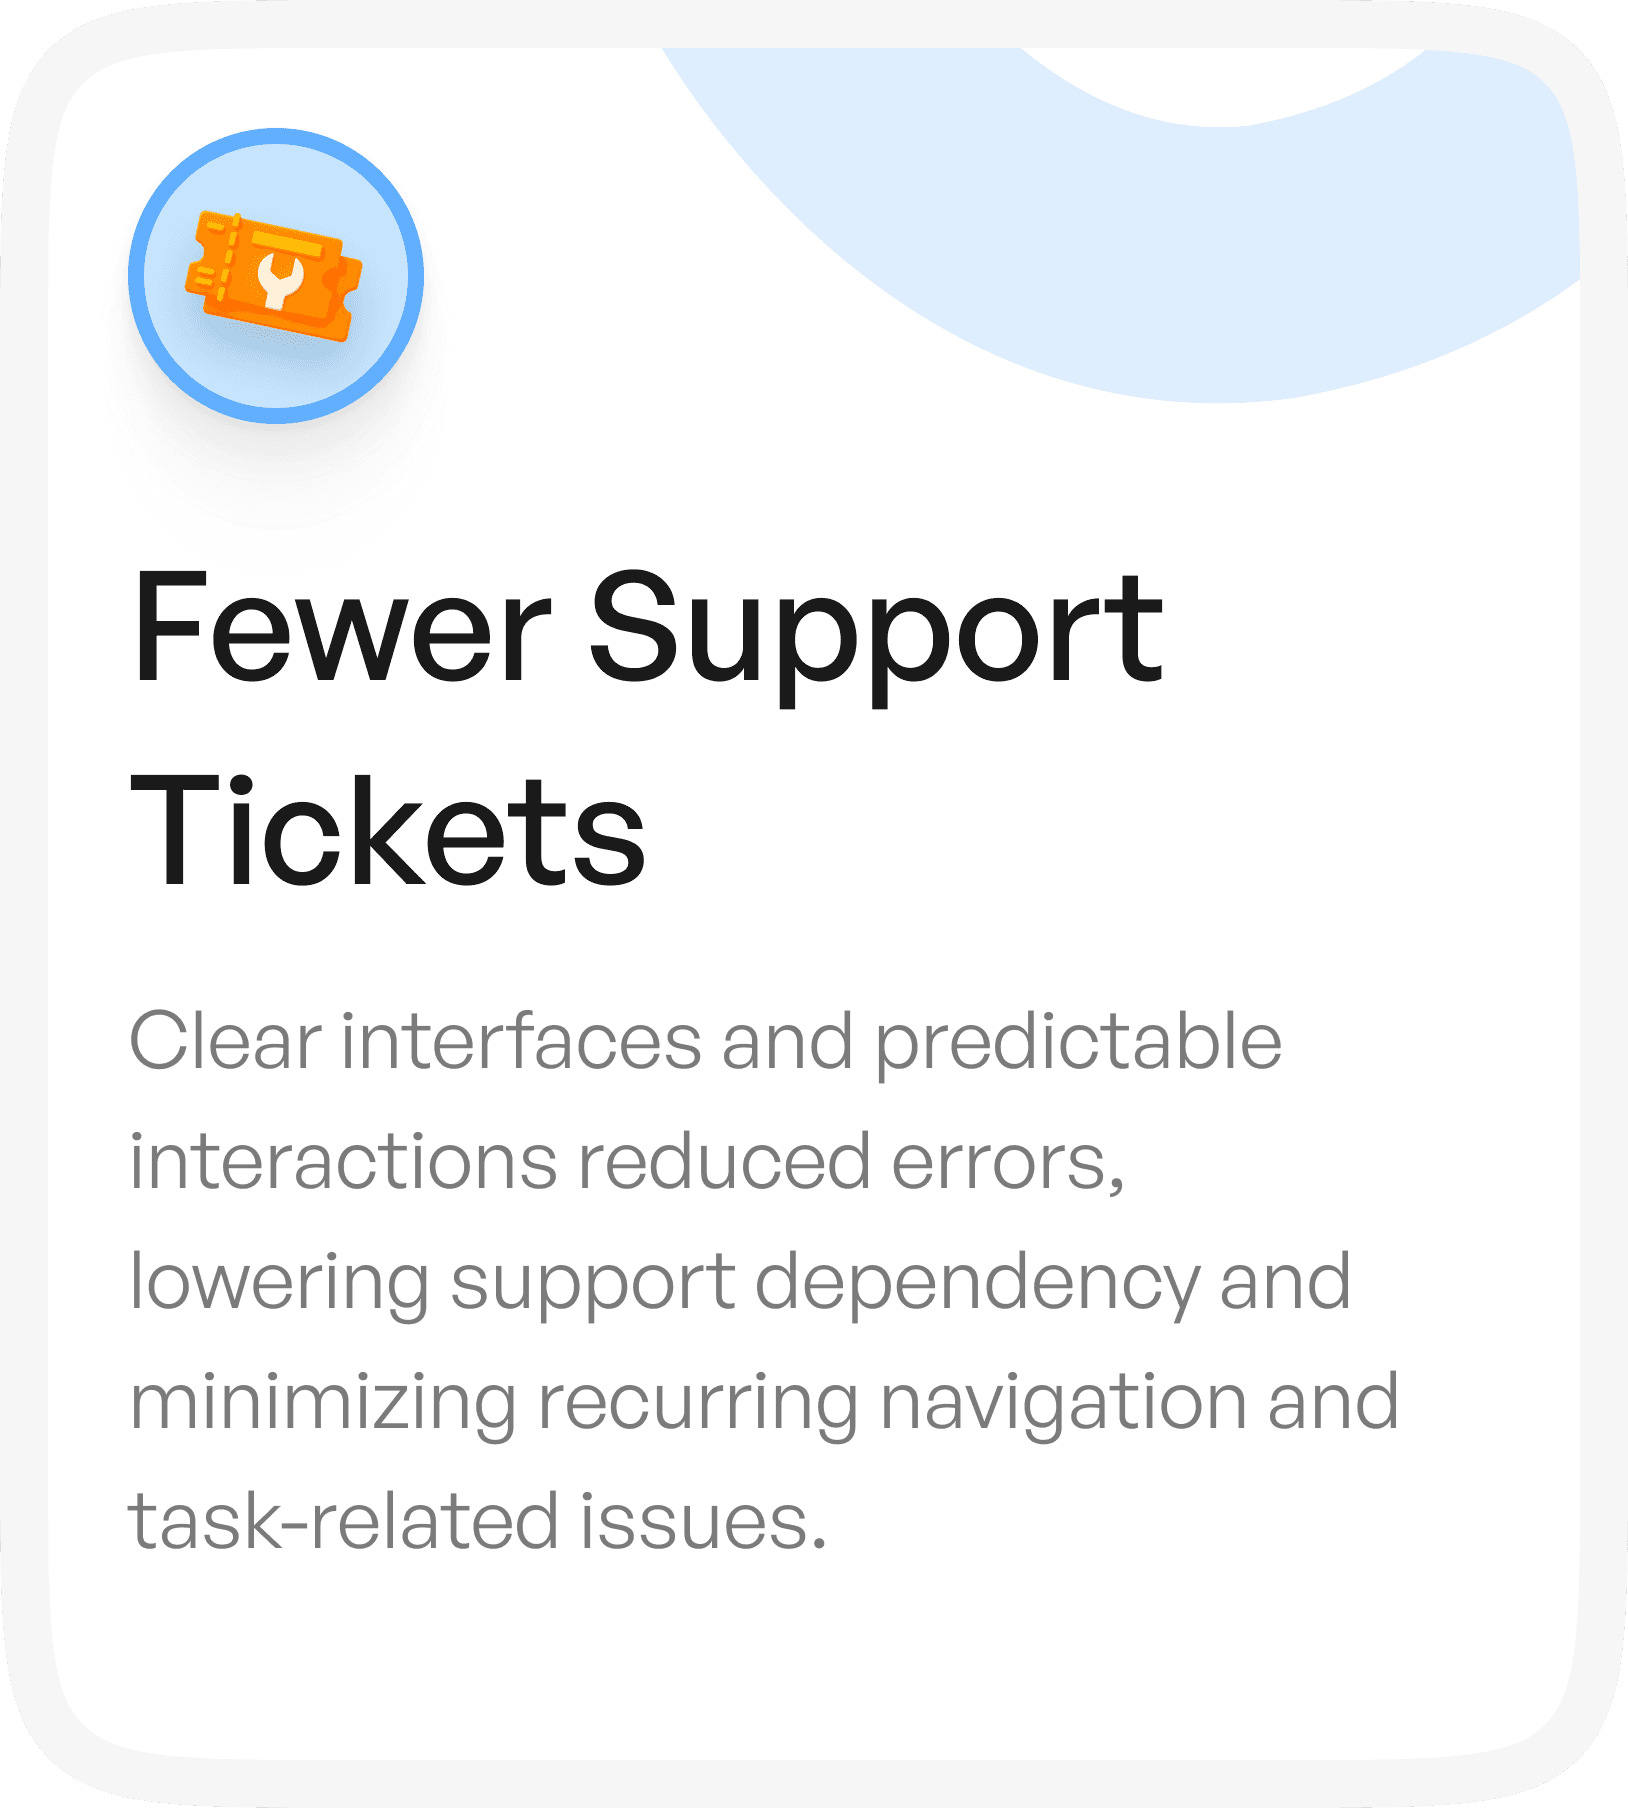
Years of Poor usability across seven apps caused repeated errors, high support dependency, and blocked Suvarna’s ability to scale diagnostic operations.
Years of Poor usability across seven apps caused repeated errors, high support dependency, and blocked Suvarna’s ability to scale diagnostic operations.
Years of Poor usability across seven apps caused repeated errors, high support dependency, and blocked Suvarna’s ability to scale diagnostic operations.
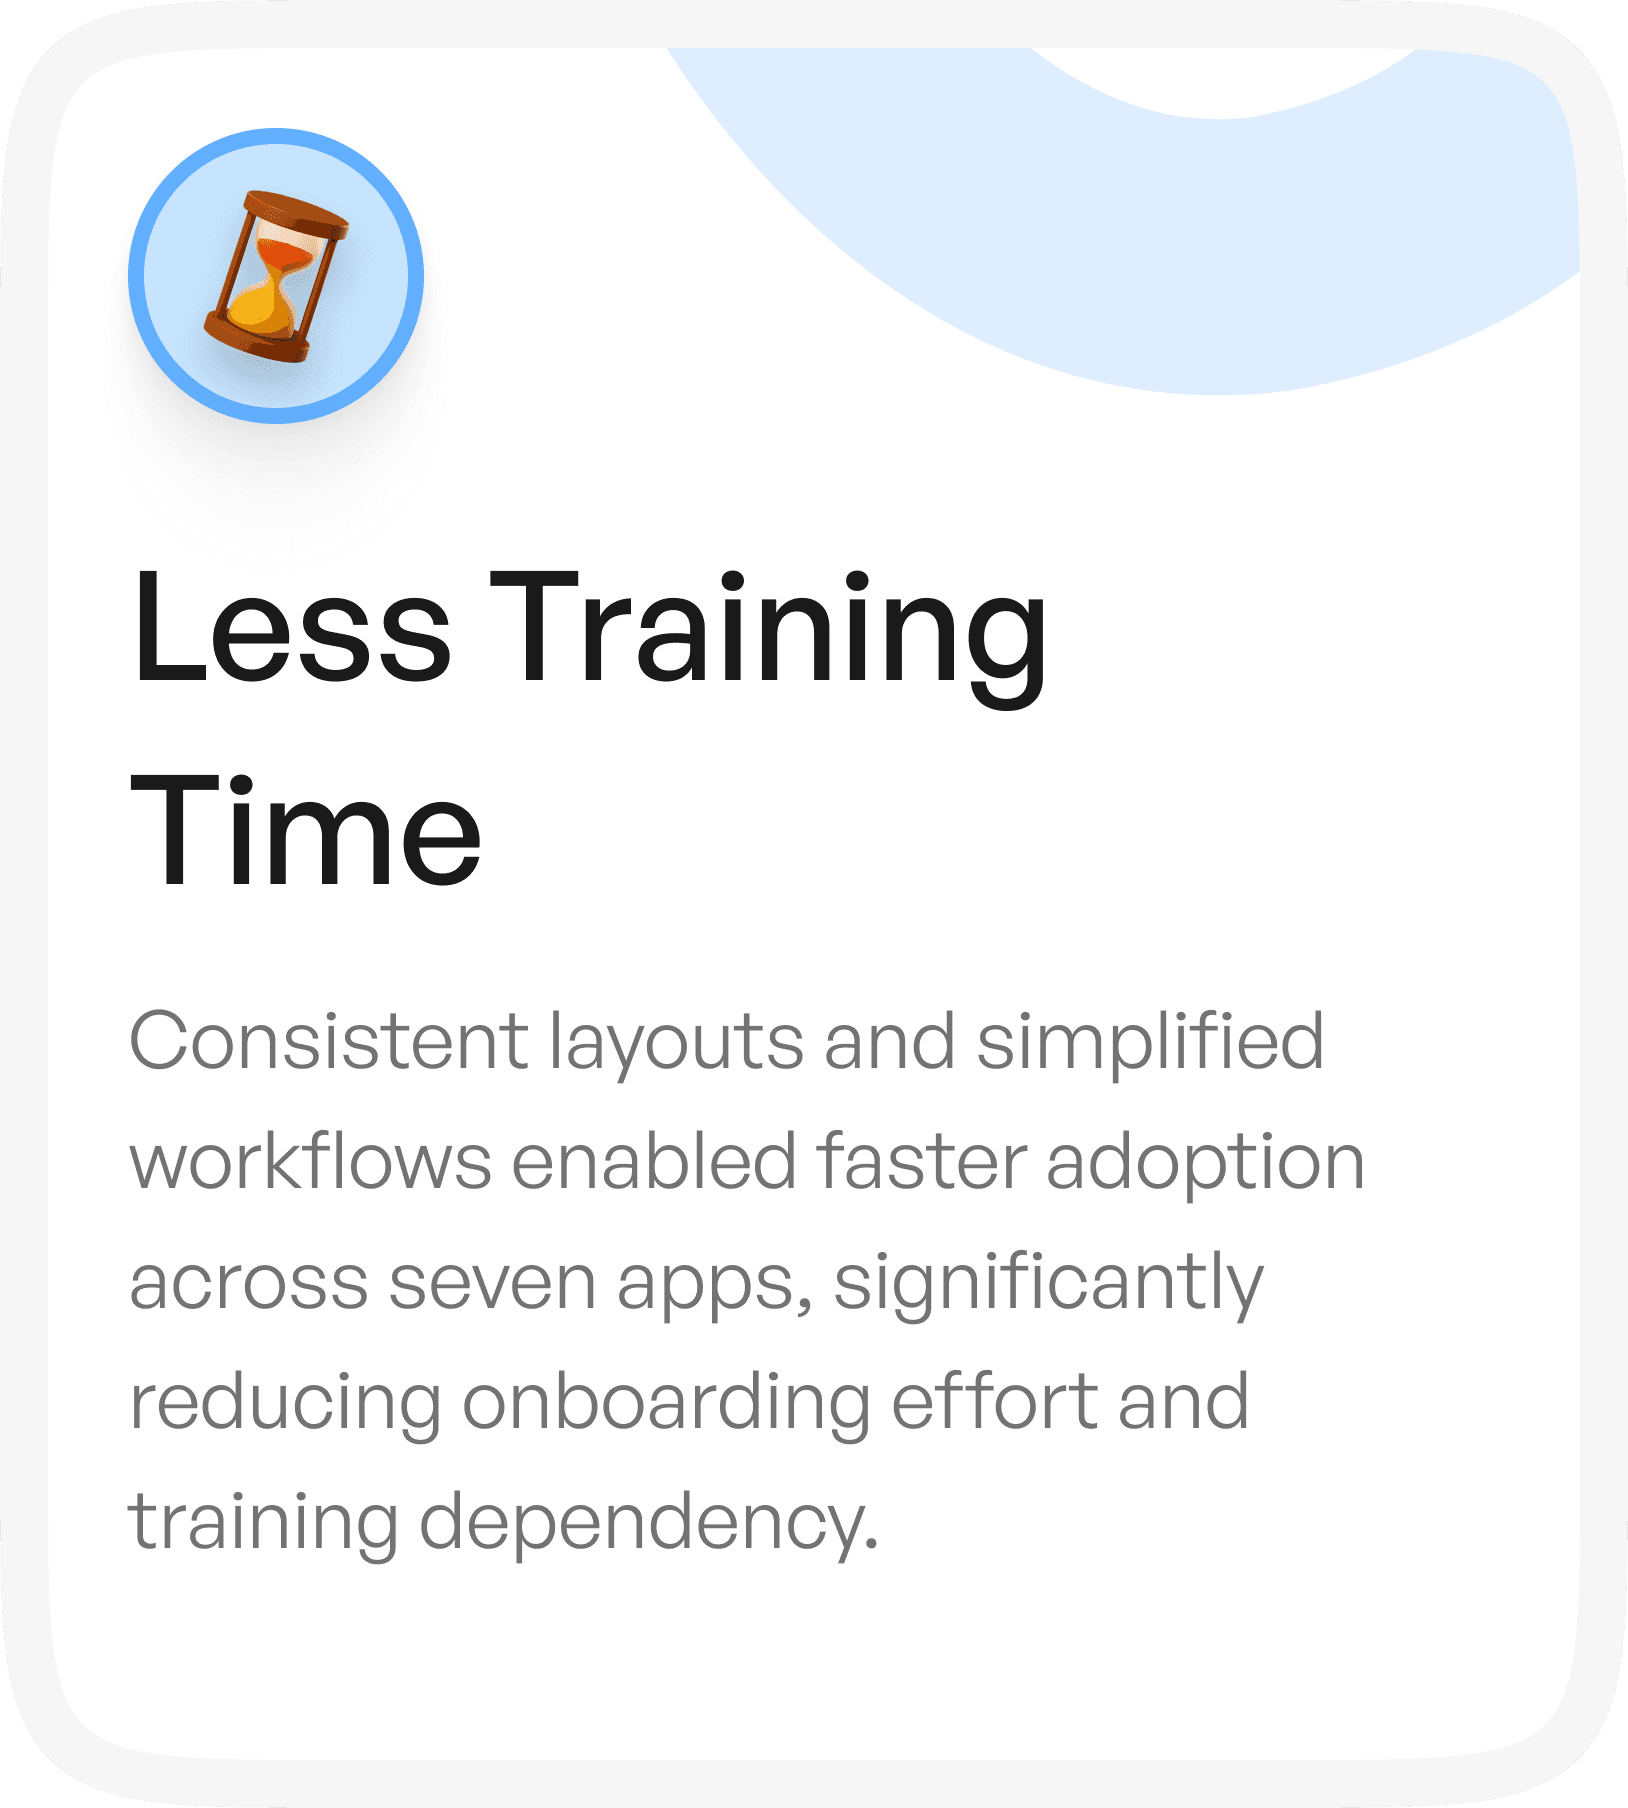
Heavy training Requirement
Heavy training Requirement
Non-intuitive workflows forced ongoing training, increased errors, slowed operations, and made everyday tasks dependent on constant guidance.
Non-intuitive workflows forced ongoing training, increased errors, slowed operations, and made everyday tasks dependent on constant guidance.
Heavy training Requirement
Non-intuitive workflows forced ongoing training, increased errors, slowed operations, and made everyday tasks dependent on constant guidance.
Our Approach
Our Approach
Our Approach
User Flow
We mapped every user journey across all seven Suvarna mobile apps—from booking and collections to doctor review, logistics, and reporting. This helped us uncover friction points, redundant steps, and broken navigation patterns that prevented users from completing tasks smoothly.
User Flow
We mapped every user journey across all seven Suvarna mobile apps—from booking and collections to doctor review, logistics, and reporting. This helped us uncover friction points, redundant steps, and broken navigation patterns that prevented users from completing tasks smoothly.
User Flow
We mapped every user journey across all seven Suvarna mobile apps—from booking and collections to doctor review, logistics, and reporting. This helped us uncover friction points, redundant steps, and broken navigation patterns that prevented users from completing tasks smoothly.
Key Problems
Key Problems
Key Problems
UREMR Dashboard
UREMR Dashboard
UREMR Dashboard
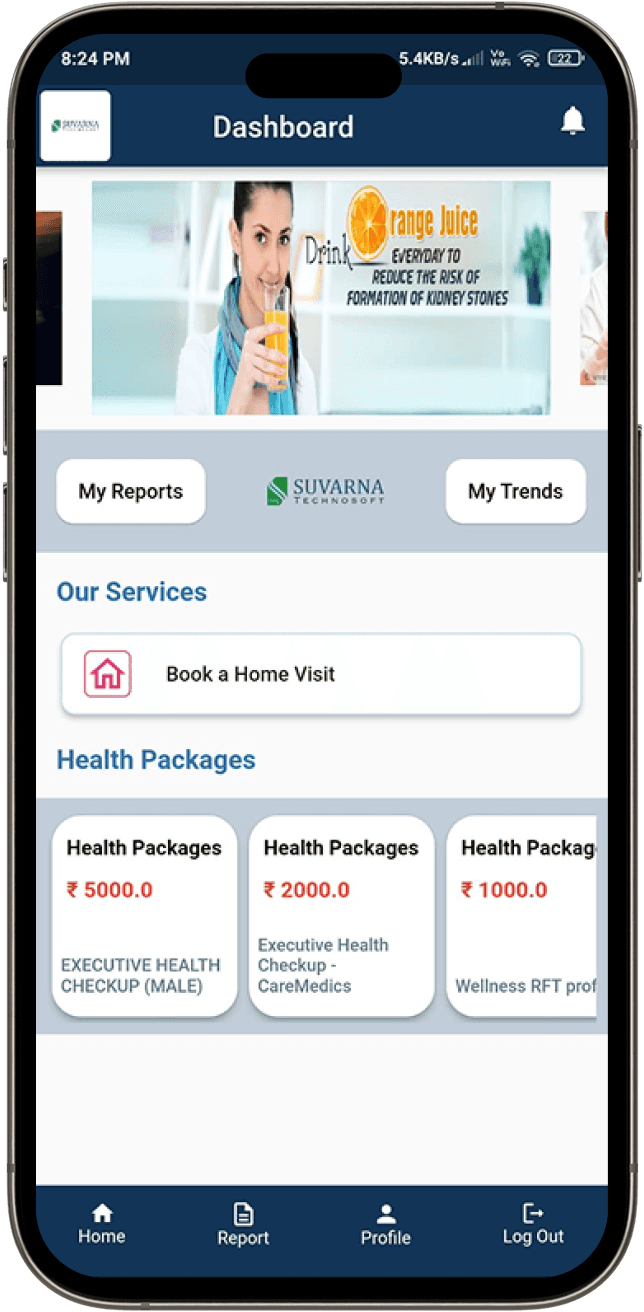
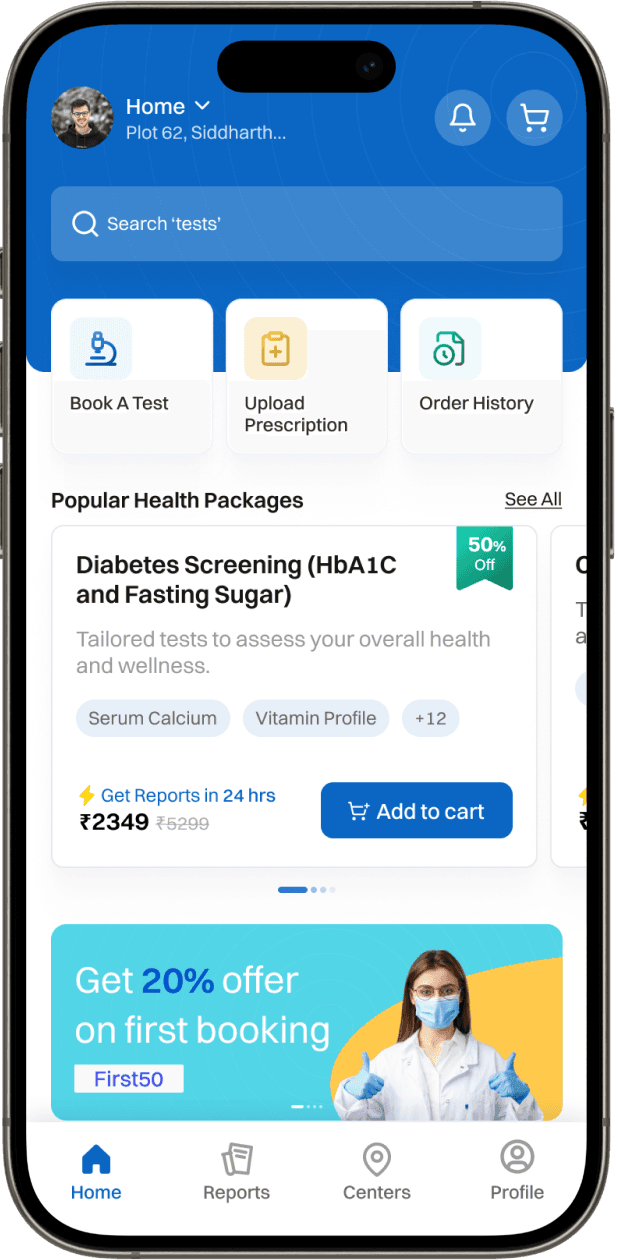
This main screen was meant to help users book tests, view reports, and explore health packages, but scattered options, unclear information, and distracting elements made it confusing, slow to use, and difficult to rely on for daily needs.
This main screen was meant to help users book tests, view reports, and explore health packages, but scattered options, unclear information, and distracting elements made it confusing, slow to use, and difficult to rely on for daily needs.
Primary Actions My Reports / My Trends Buttons looked identical and disconnected from the main flow, leaving users unsure which to select.
Primary Actions My Reports / My Trends Buttons looked identical and disconnected from the main flow, leaving users unsure which to select.
Our Services Section “Book a Home Visit” was shown without context, and its visual weight made it seem unrelated to the main tasks.
Our Services Section “Book a Home Visit” was shown without context, and its visual weight made it seem unrelated to the main tasks.
Health Packages Section, Packages looked repetitive with identical titles, missing details, and unclear pricing, making comparison or selection difficult.
Health Packages Section, Packages looked repetitive with identical titles, missing details, and unclear pricing, making comparison or selection difficult.
Bottom Navigation Icons and labels were inconsistent, causing confusion about where key actions like booking, reports, or profile management actually lived.
Bottom Navigation Icons and labels were inconsistent, causing confusion about where key actions like booking, reports, or profile management actually lived.
Lab Sales Dashboard
Lab Sales Dashboard
Lab Sales Dashboard
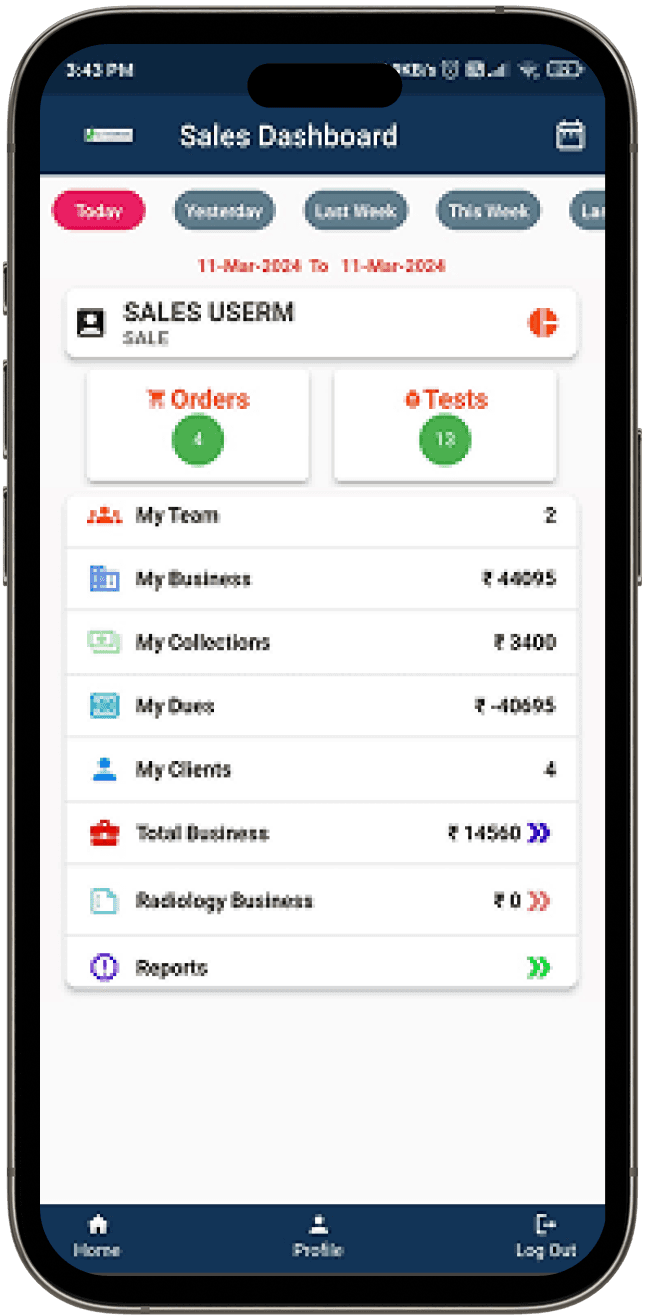
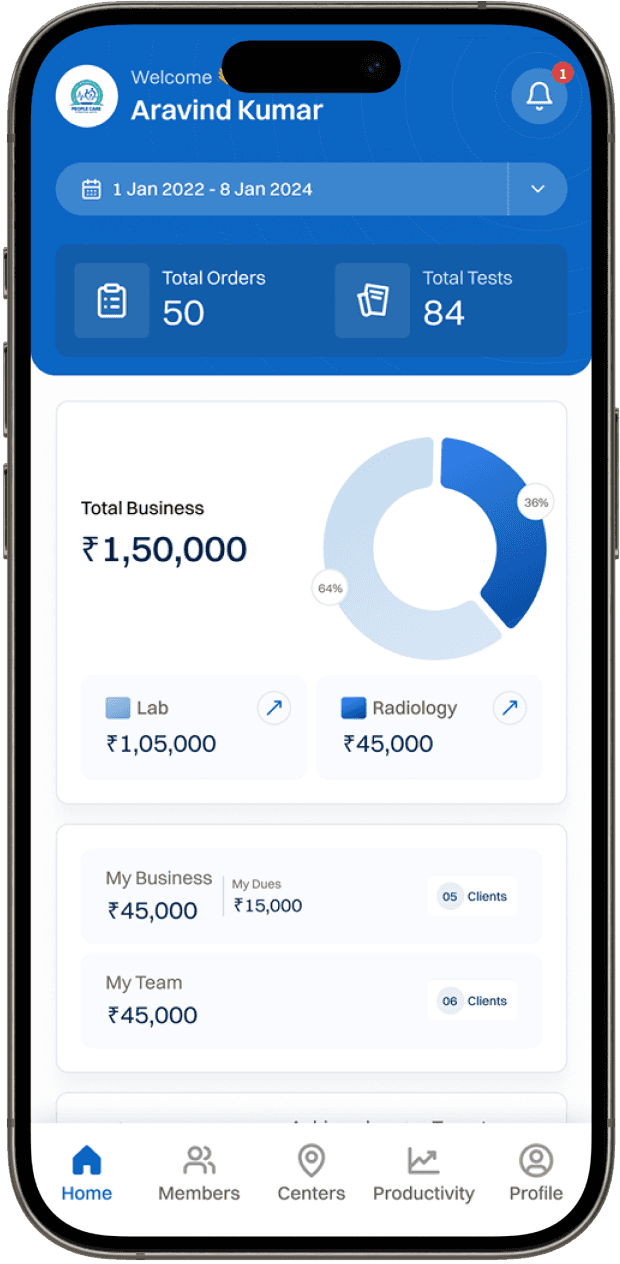
This sales screen was meant to help teams track orders, collections, dues, and business performance, but cluttered sections, mixed actions, and unclear numbers made it hard for staff to understand daily progress or take quick decisions.
This sales screen was meant to help teams track orders, collections, dues, and business performance, but cluttered sections, mixed actions, and unclear numbers made it hard for staff to understand daily progress or take quick decisions.
Orders & Tests section showed numbers without clarity on what they represented, causing uncertainty about daily workload.
Orders & Tests section showed numbers without clarity on what they represented, causing uncertainty about daily workload.
My Collections / My Dues sections lacked context, leaving users unsure of what was collected, pending, or overdue.
My Collections / My Dues sections lacked context, leaving users unsure of what was collected, pending, or overdue.
My Clients section displayed only counts but offered no insight into client activity or performance.
My Clients section displayed only counts but offered no insight into client activity or performance.
Total Business & Radiology Business sections placed critical figures at the bottom, making key information easy to miss during daily checks.
Total Business & Radiology Business sections placed critical figures at the bottom, making key information easy to miss during daily checks.
Key Solutions
Key Solutions
Key Solutions
UREMR Dashboard
UREMR Dashboard
UREMR Dashboard
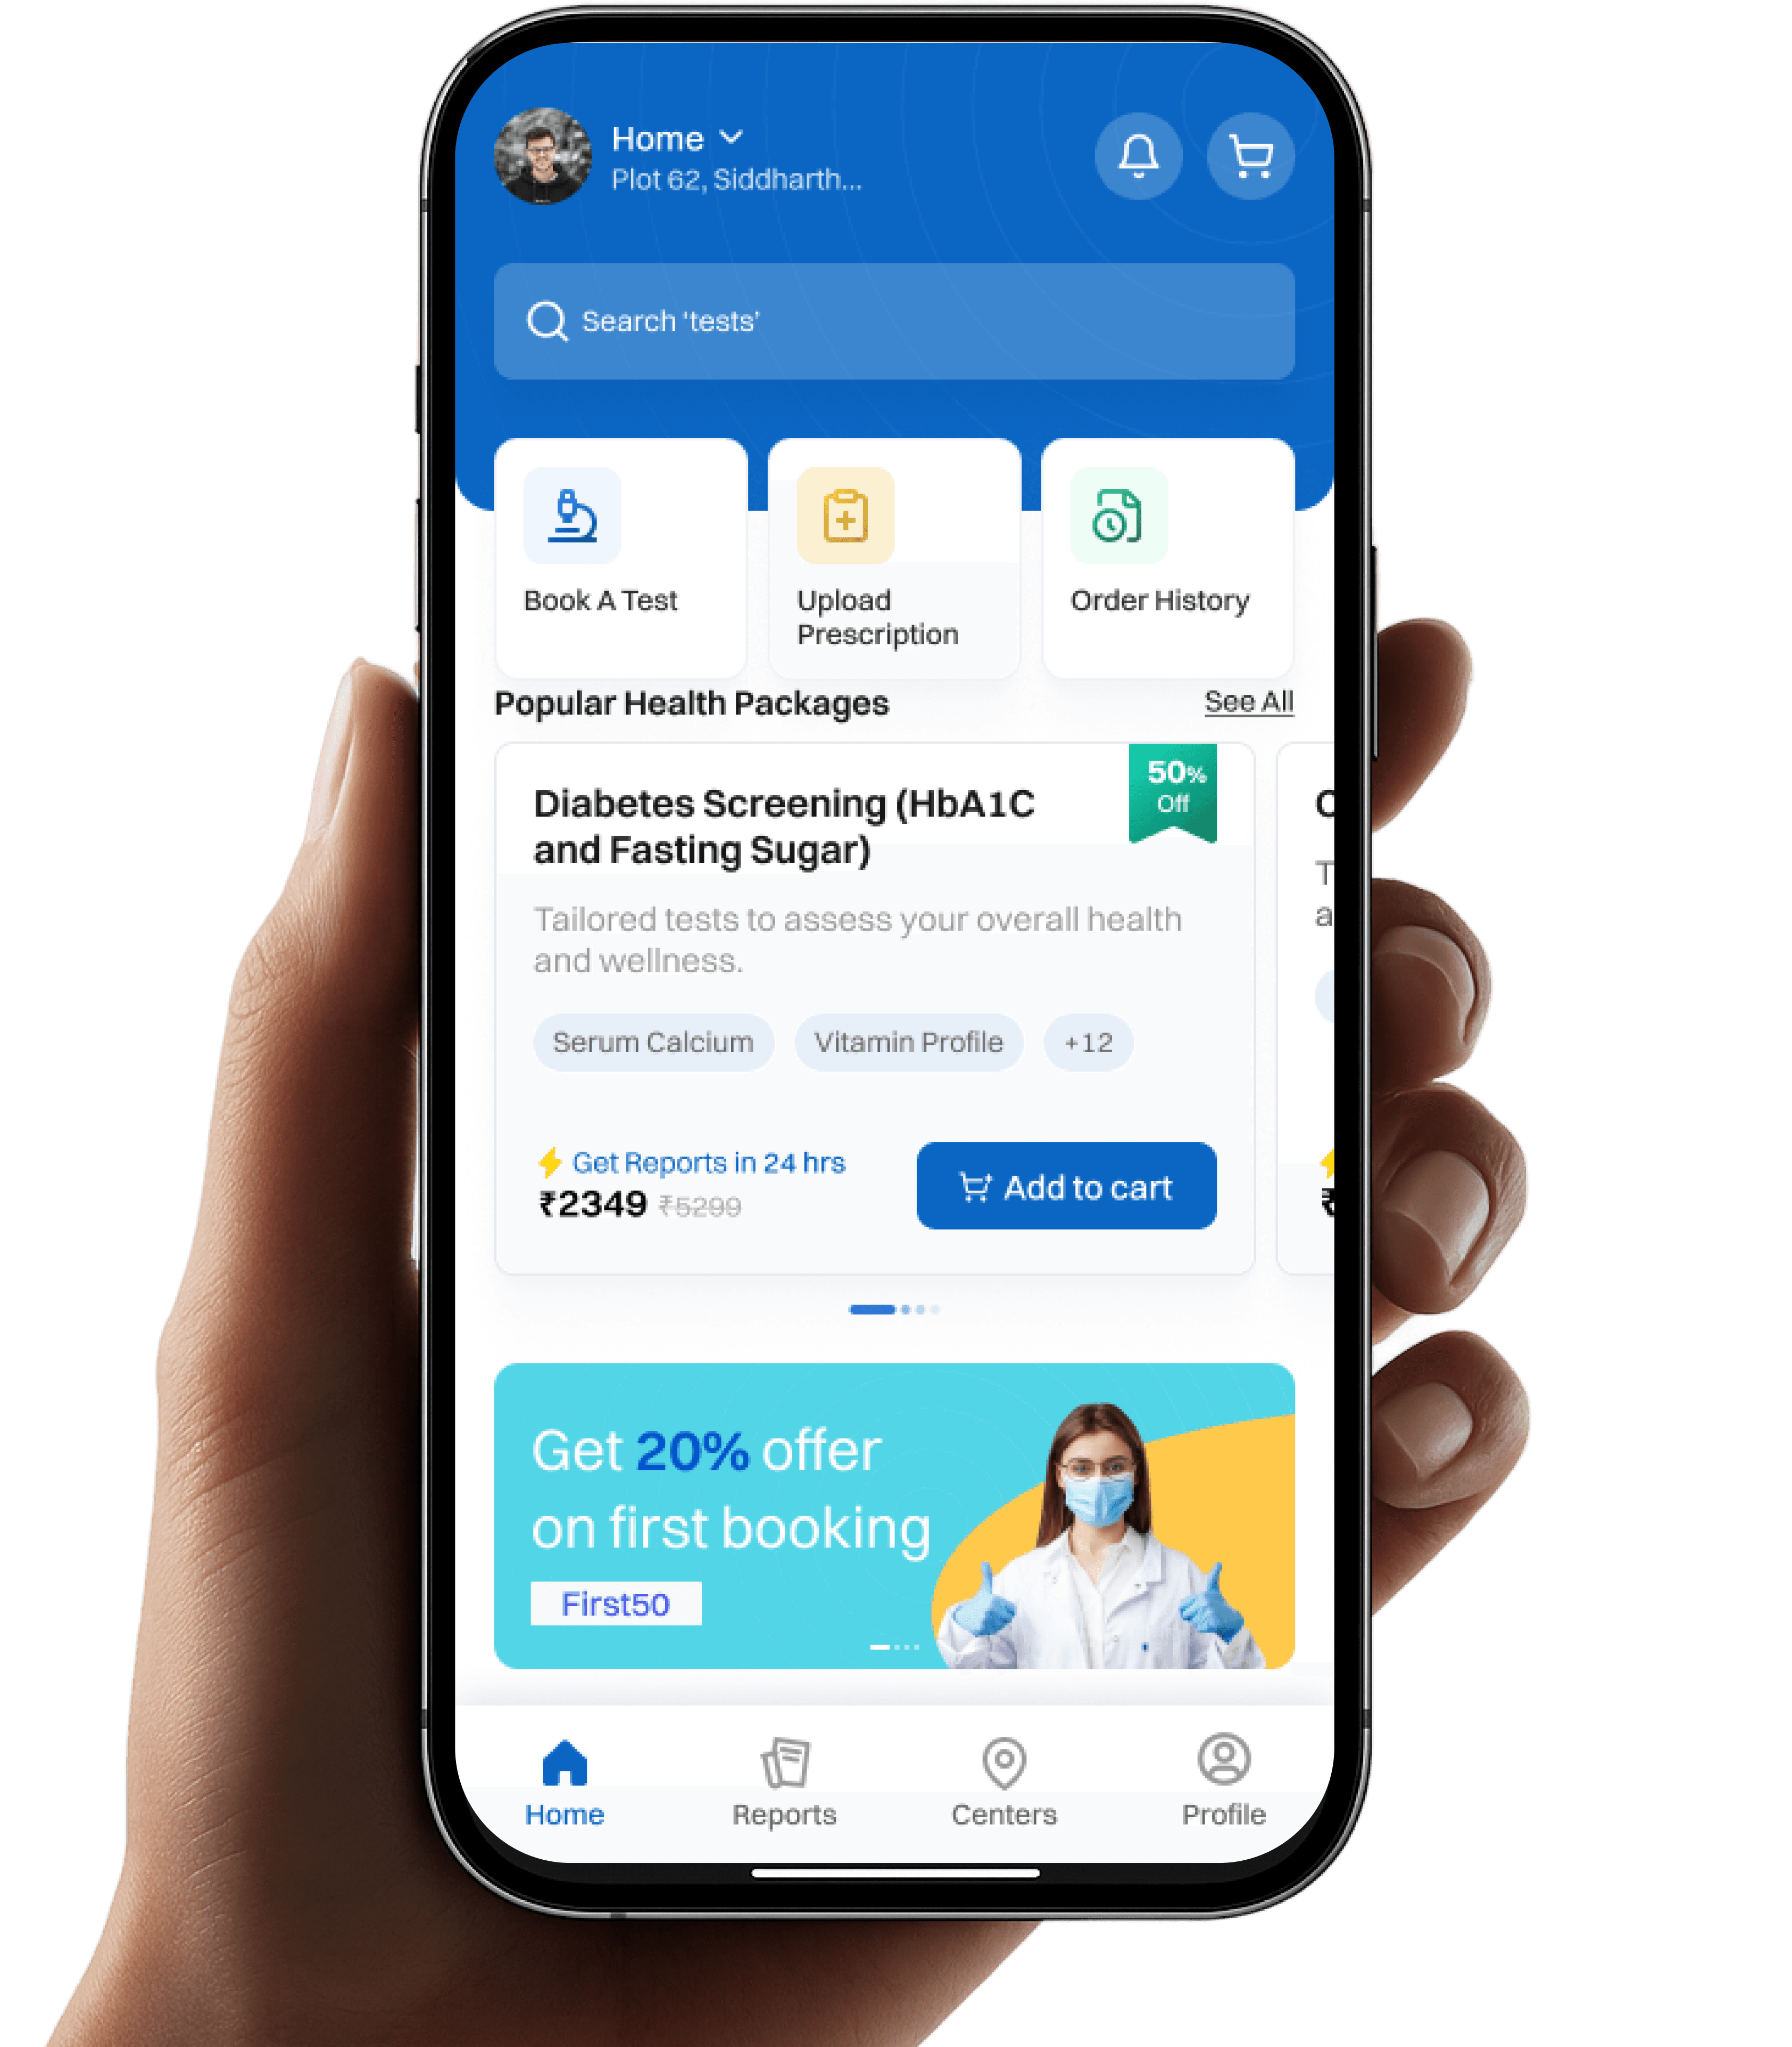
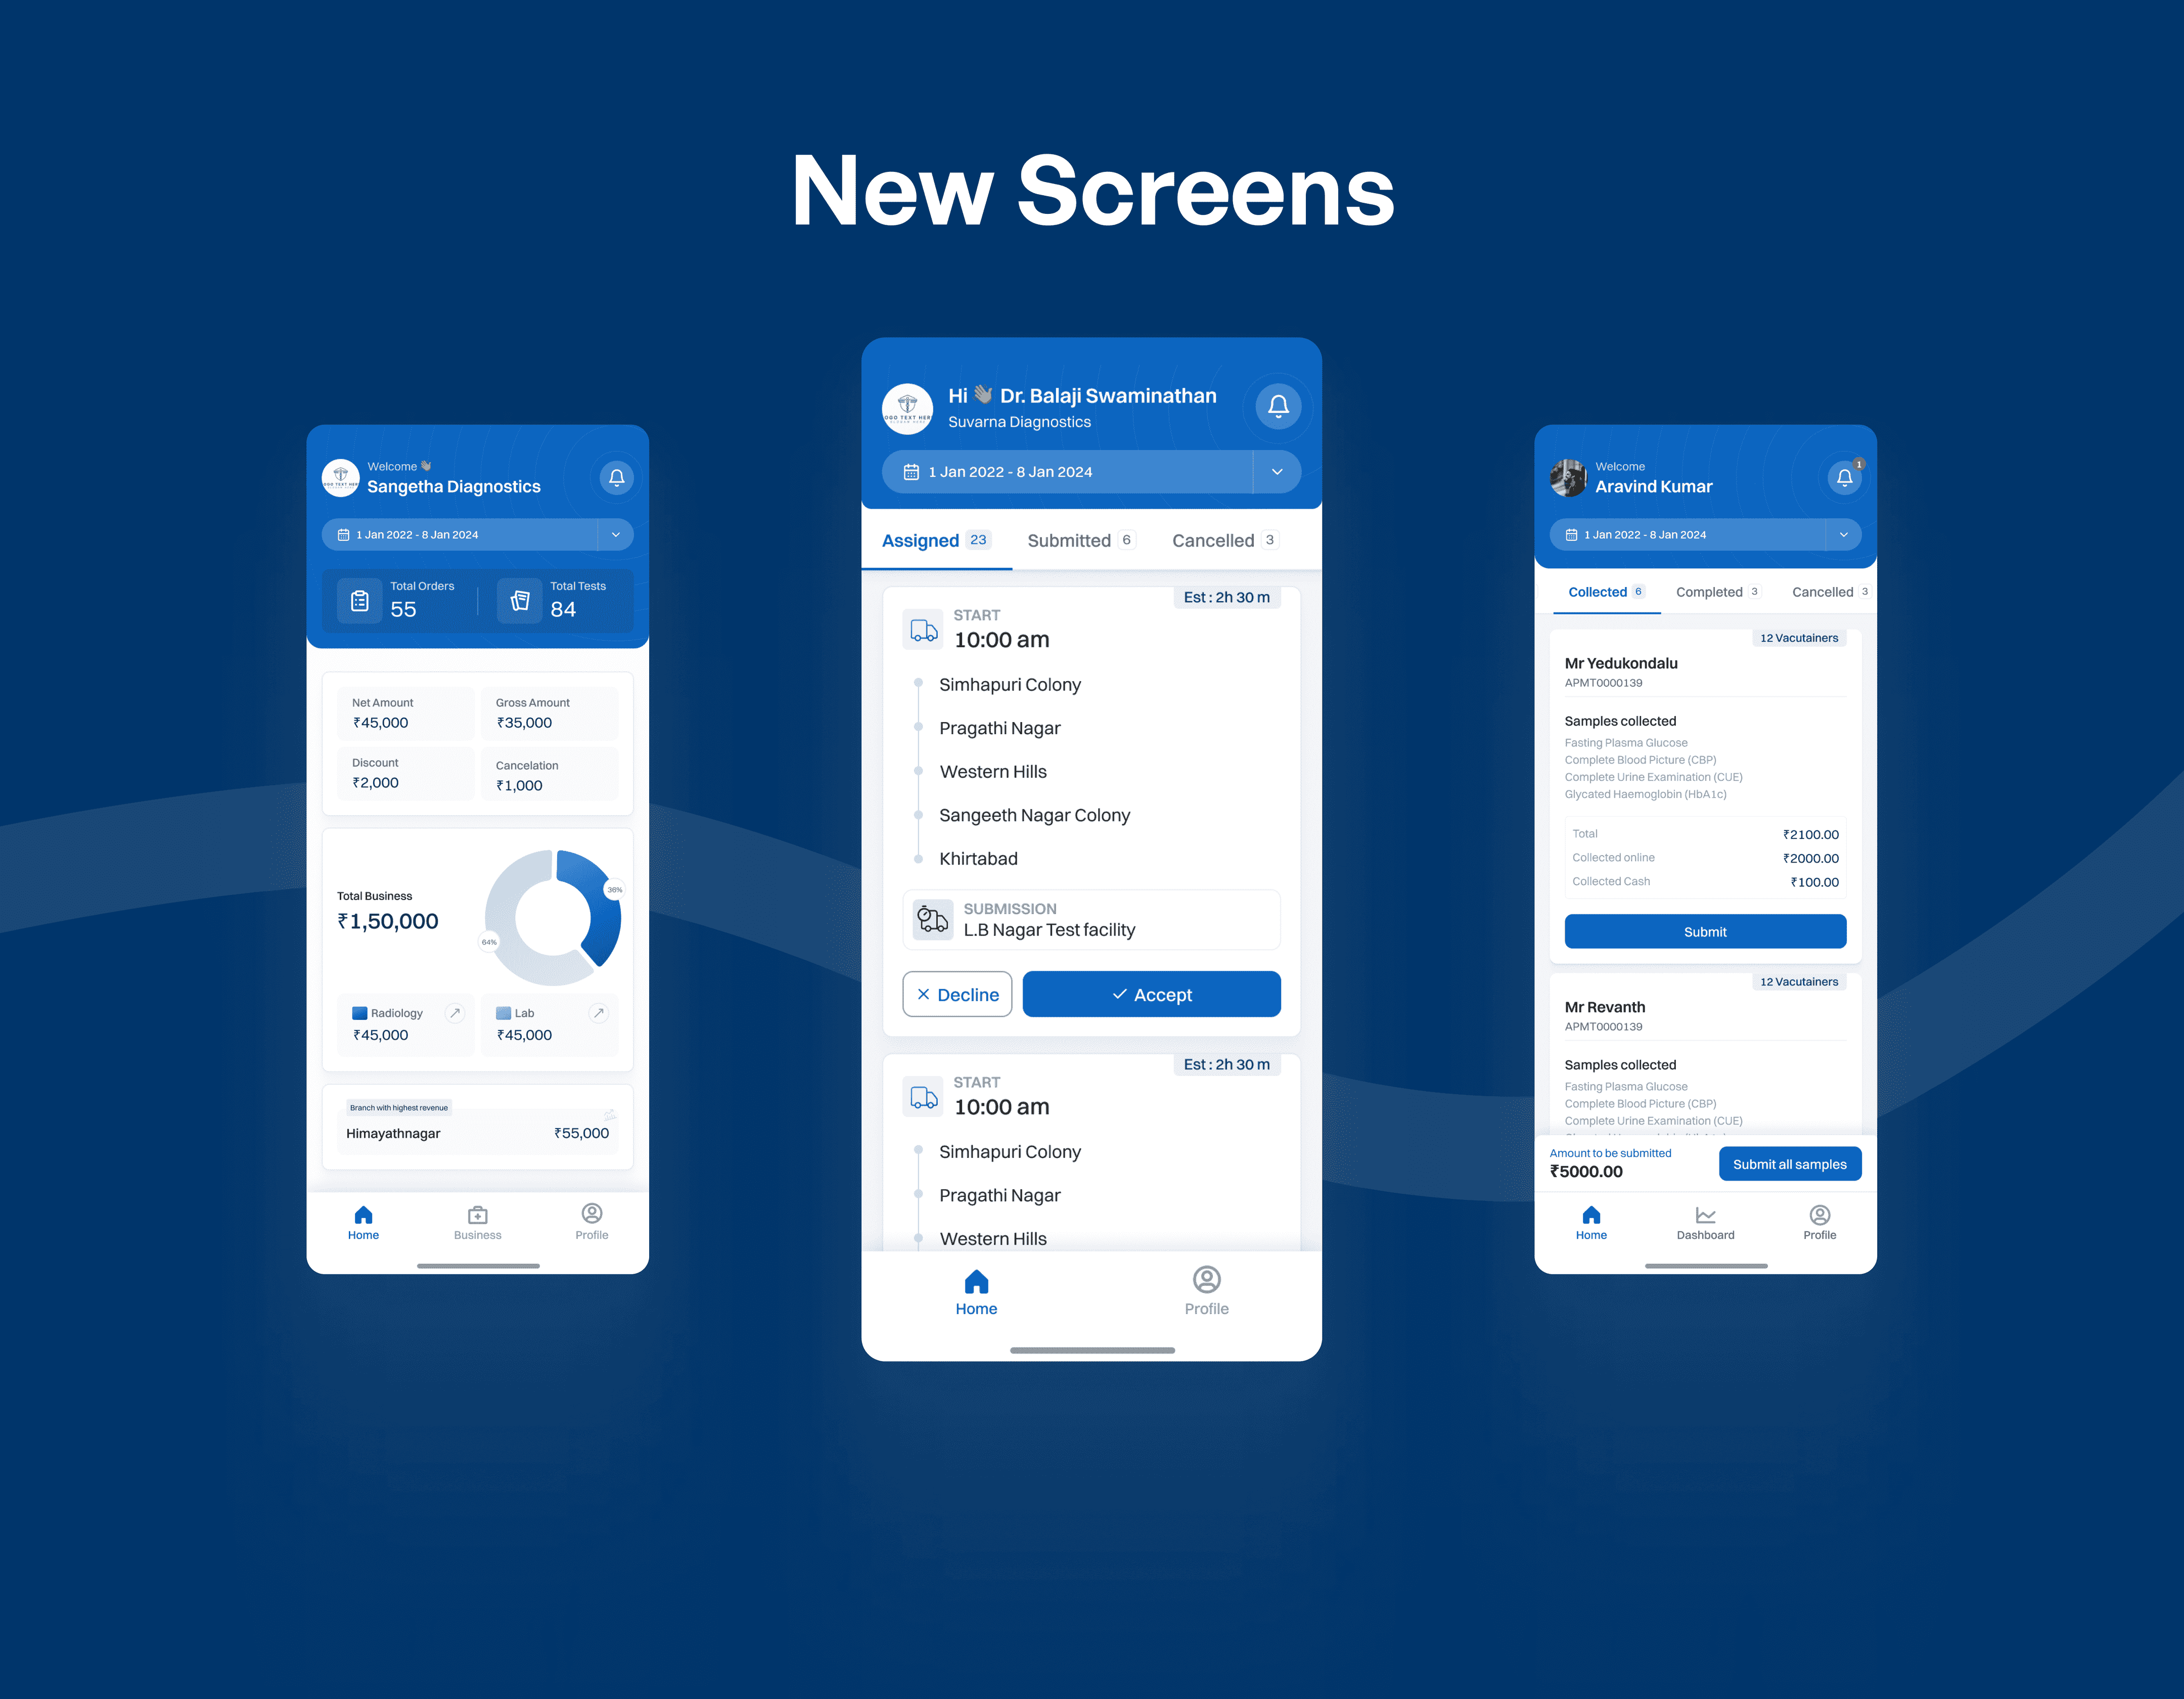
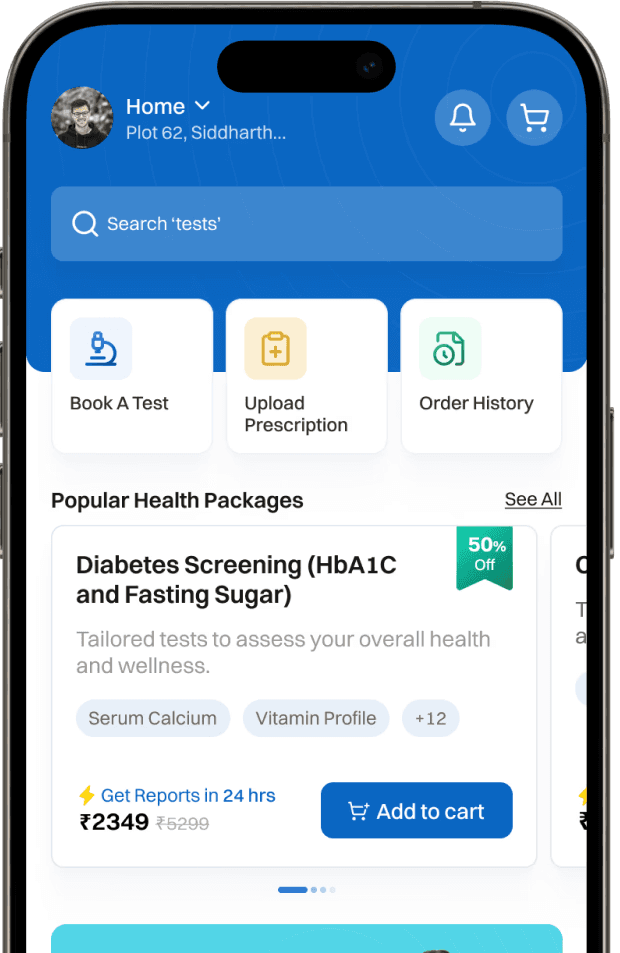
We redesigned the UREMR dashboard by re-establishing a clear task hierarchy and aligning the screen around users’ primary goals—booking tests, viewing reports, and tracking health activity.
We redesigned the UREMR dashboard by re-establishing a clear task hierarchy and aligning the screen around users’ primary goals—booking tests, viewing reports, and tracking health activity.
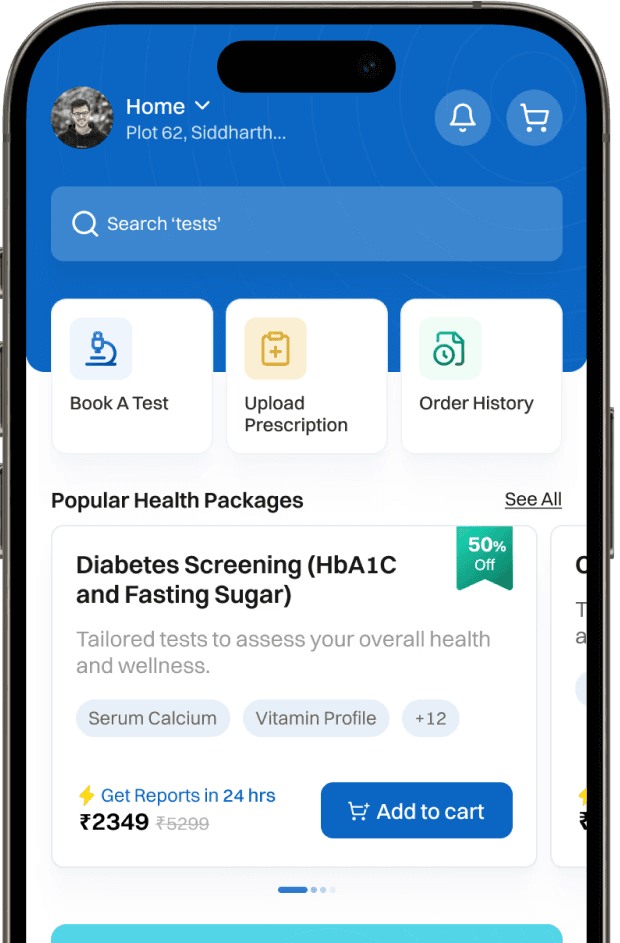
Clear primary actions: Booking tests, uploading prescriptions, and viewing order history are surfaced upfront as distinct, scannable actions.
Clear primary actions: Booking tests, uploading prescriptions, and viewing order history are surfaced upfront as distinct, scannable actions.
Stronger task hierarchy: Reports, packages, and offers are structured by priority, reducing visual noise and decision fatigue.
Stronger task hierarchy: Reports, packages, and offers are structured by priority, reducing visual noise and decision fatigue.
Contextual packages: Health packages now include clear titles, key inclusions, pricing, and CTAs—making comparison and selection effortless.
Contextual packages: Health packages now include clear titles, key inclusions, pricing, and CTAs—making comparison and selection effortless.
Consistent navigation: Unified bottom navigation with clear labels ensures users always know where to book, track, or manage profiles.
Consistent navigation: Unified bottom navigation with clear labels ensures users always know where to book, track, or manage profiles.
Lab Sales Dashboard
Lab Sales Dashboard
Lab Sales Dashboard
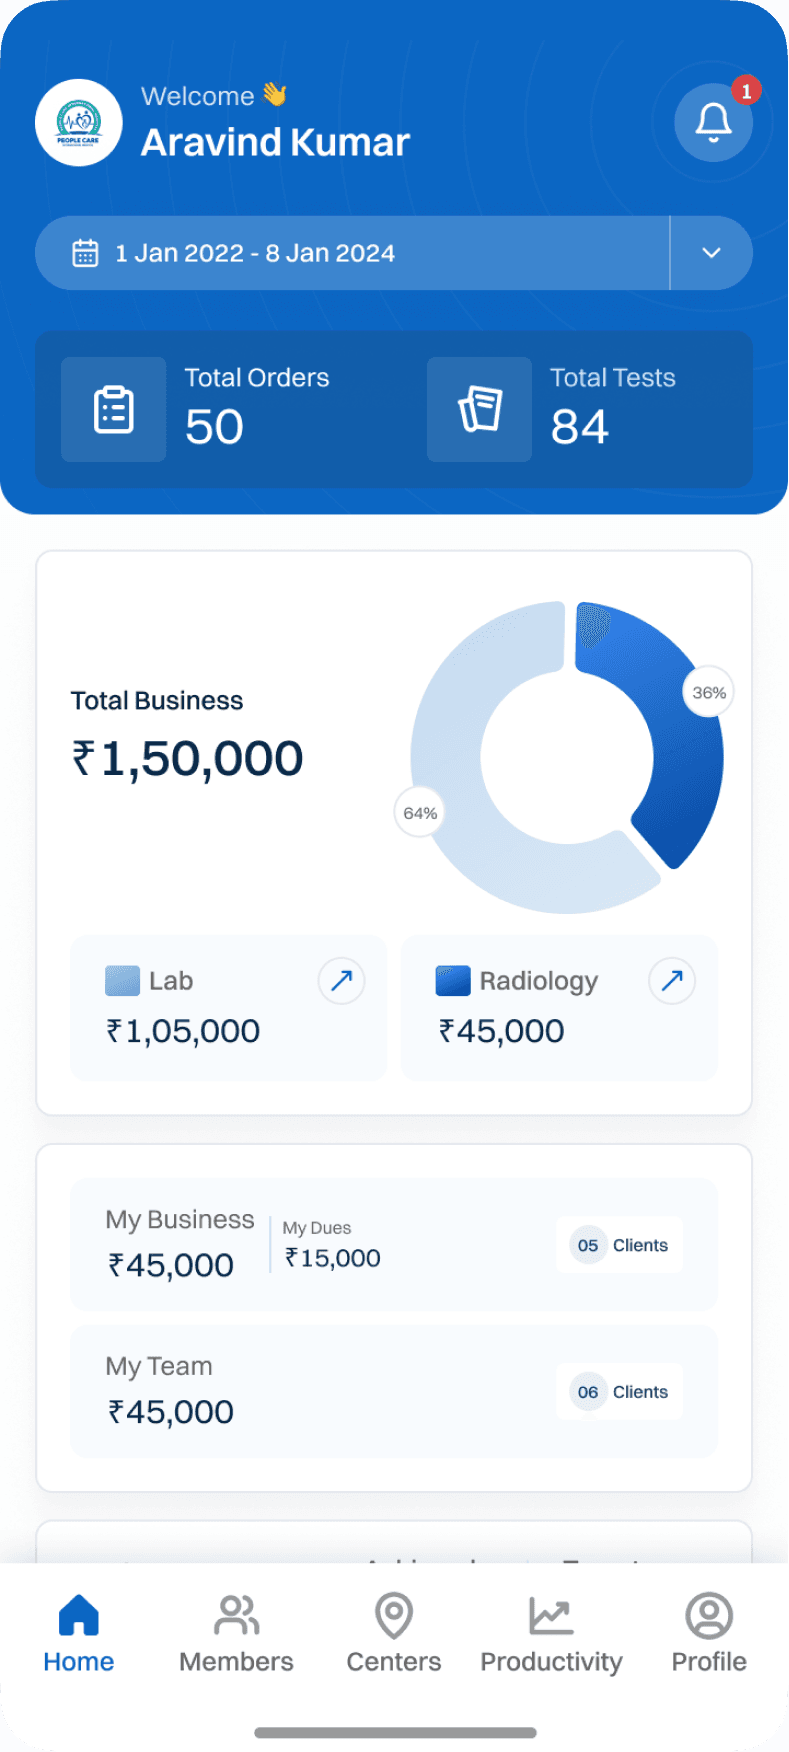
The redesigned dashboard delivers instant clarity on sales performance, enabling faster decisions, better prioritization, and confident daily tracking.
The redesigned dashboard delivers instant clarity on sales performance, enabling faster decisions, better prioritization, and confident daily tracking.
Clear KPI grouping: Orders, tests, collections, and dues are clearly labelled with context, eliminating ambiguity around daily performance.
Clear KPI grouping: Orders, tests, collections, and dues are clearly labelled with context, eliminating ambiguity around daily performance.
Actionable financial insights: Collections and dues are broken down visibly, helping staff instantly understand paid, pending, and overdue amounts.
Actionable financial insights: Collections and dues are broken down visibly, helping staff instantly understand paid, pending, and overdue amounts.
Client visibility: Client counts are paired with performance indicators, giving teams clearer insight into client activity and contribution.
Client visibility: Client counts are paired with performance indicators, giving teams clearer insight into client activity and contribution.
Priority-first layout: Total and radiology business metrics are surfaced upfront, ensuring critical revenue data is never missed.
Priority-first layout: Total and radiology business metrics are surfaced upfront, ensuring critical revenue data is never missed.
Essential Elements that Enhanced User Experience
Essential Elements that Enhanced User Experience
Essential Elements that Enhanced User Experience
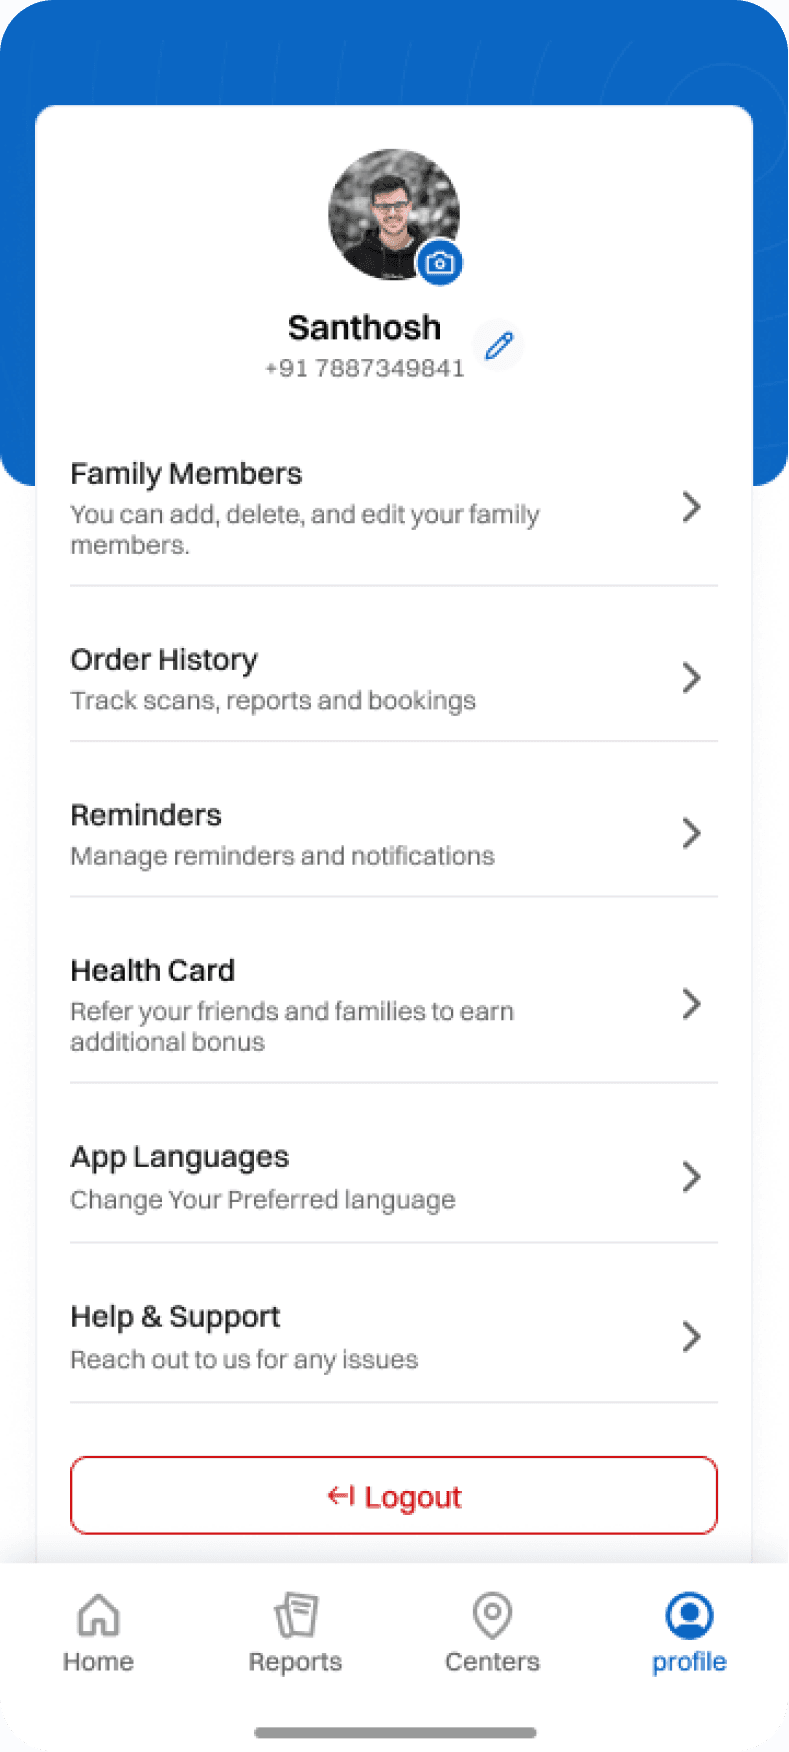
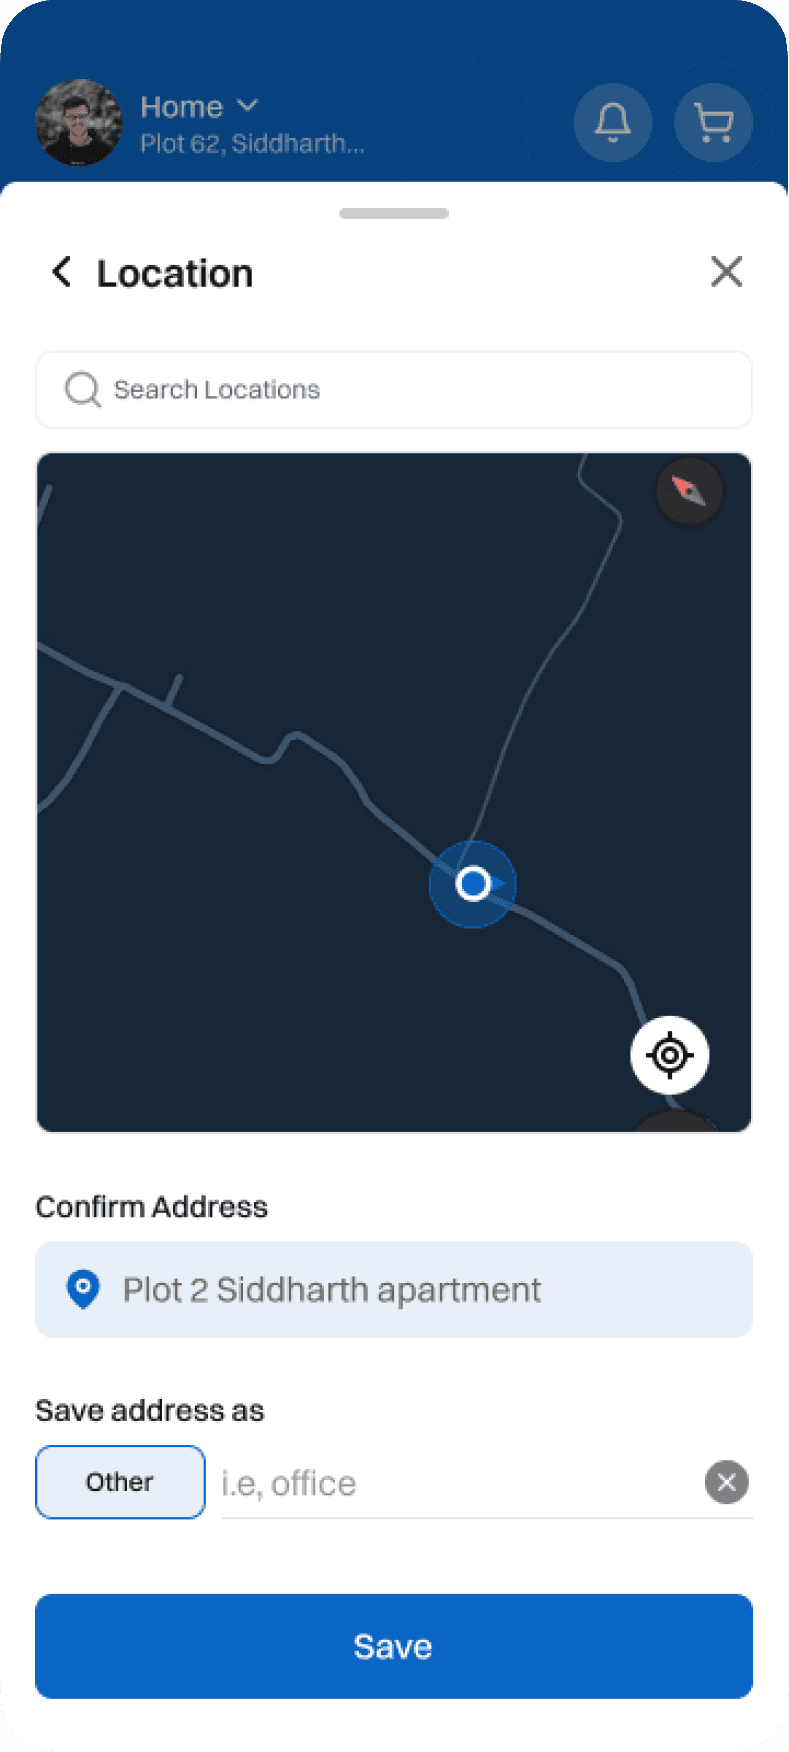
All in one app
All in one app
To book tests, upload prescriptions, manage family profiles, track phlebo visits, view reports
To book tests, upload prescriptions, manage family profiles, track phlebo visits, view reports
20+ Customized Icons
20+ Customized Icons
Created by ainul muttaqin
Created by ainul muttaqin
from the Noun Project
from the Noun Project
Created by ainul muttaqin
Created by ainul muttaqin
from the Noun Project
from the Noun Project
Created by Evon
Created by Evon
from the Noun Project
from the Noun Project
Designed to give users immediate visual clarity.
Designed to give users immediate visual clarity.
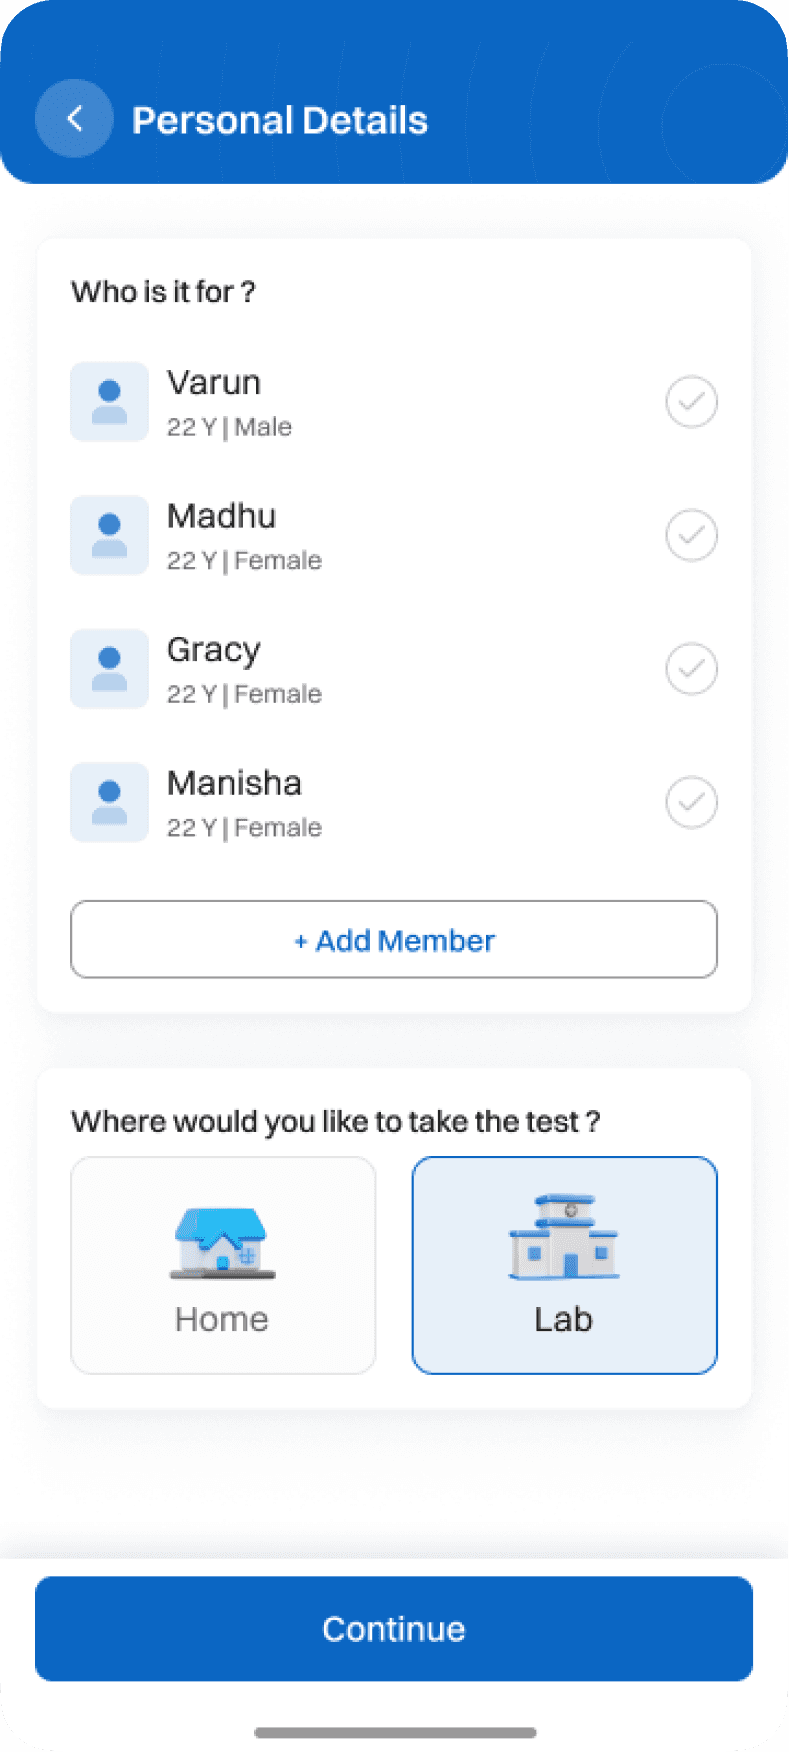
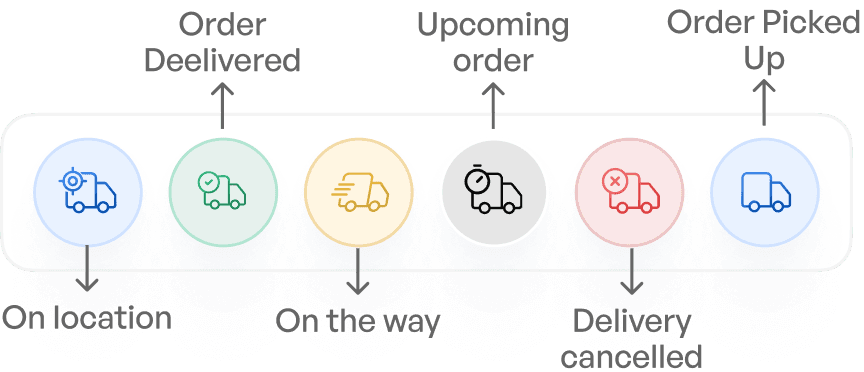
Visual Cues for the Entire Delivery Journey
Visual Cues for the Entire Delivery Journey
Each Icons highlight every order status, making progress easy to track.
Each Icons highlight every order status, making progress easy to track.
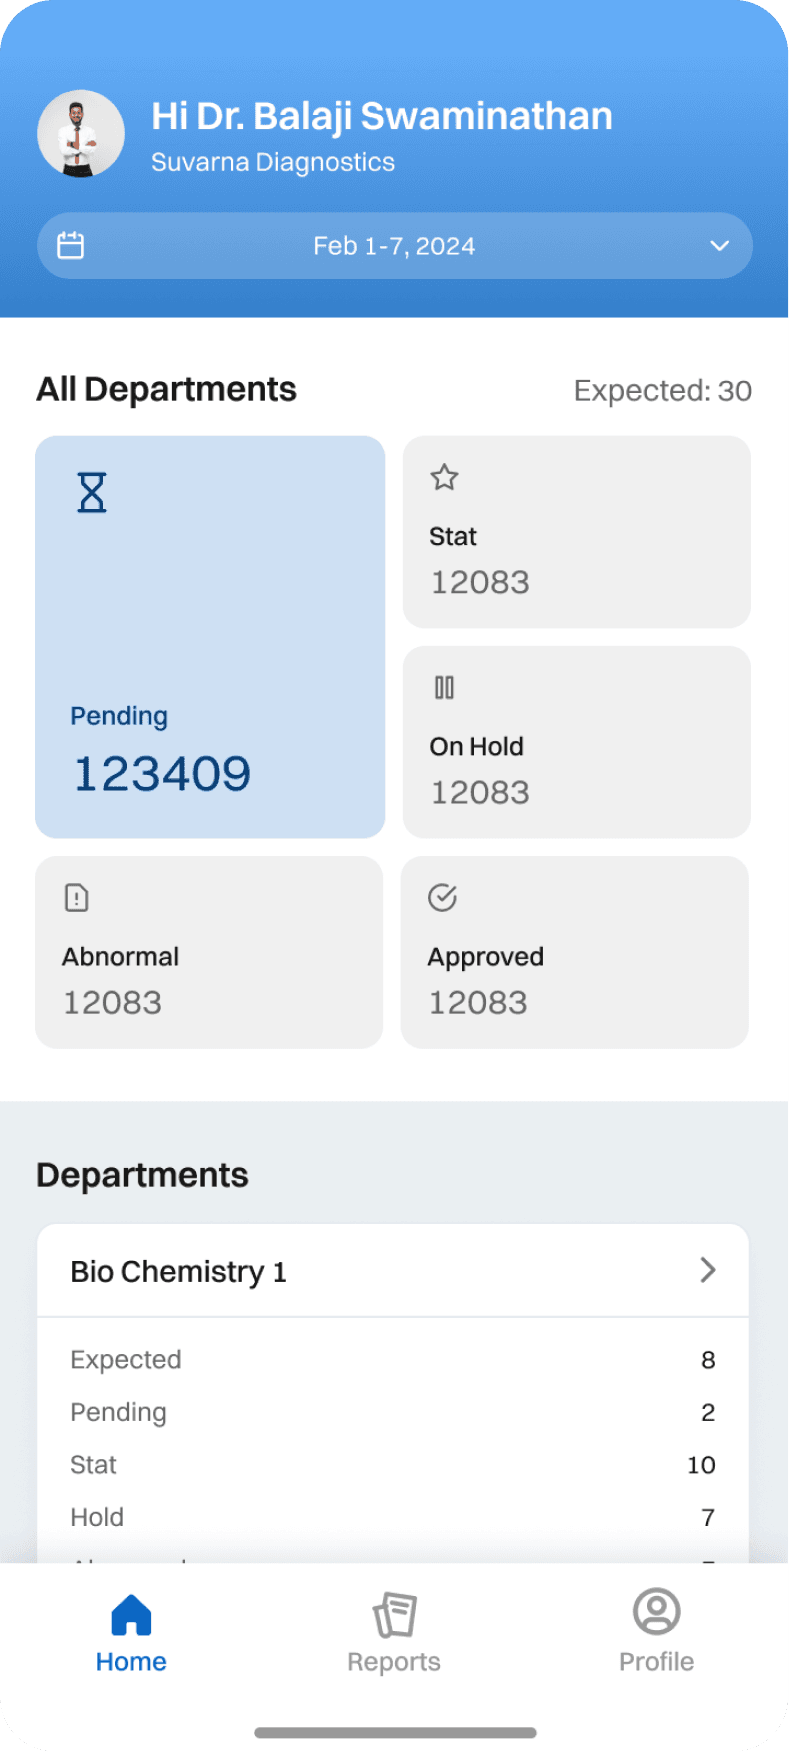
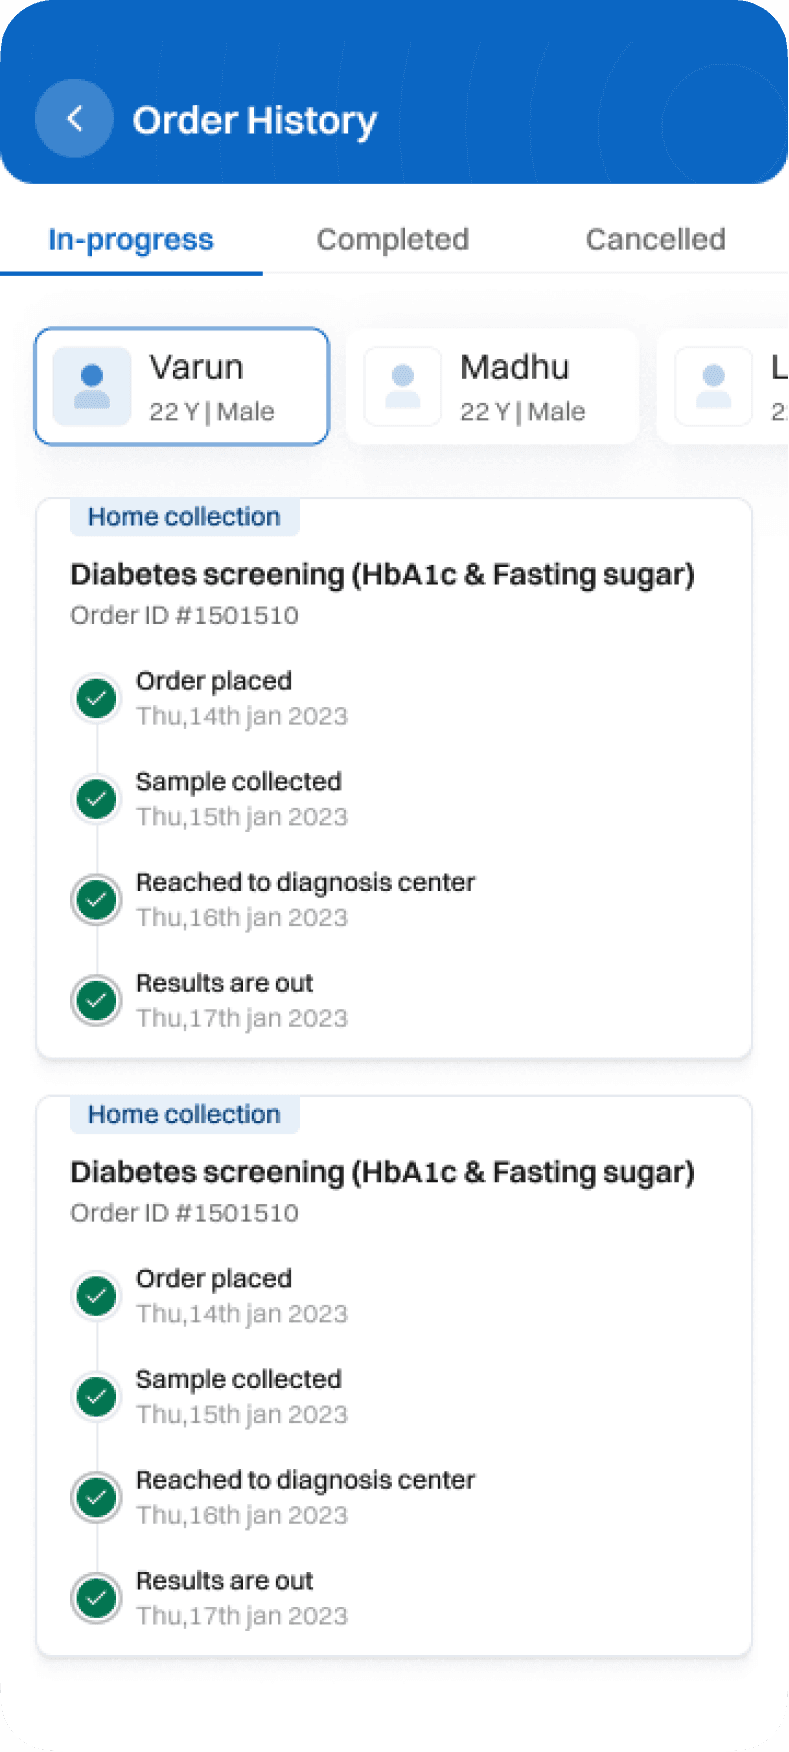
Track Test Status Effortlessly
Track Test Status Effortlessly
Easily view each client’s pending and completed test details instantly.
Easily view each client’s pending and completed test details instantly.


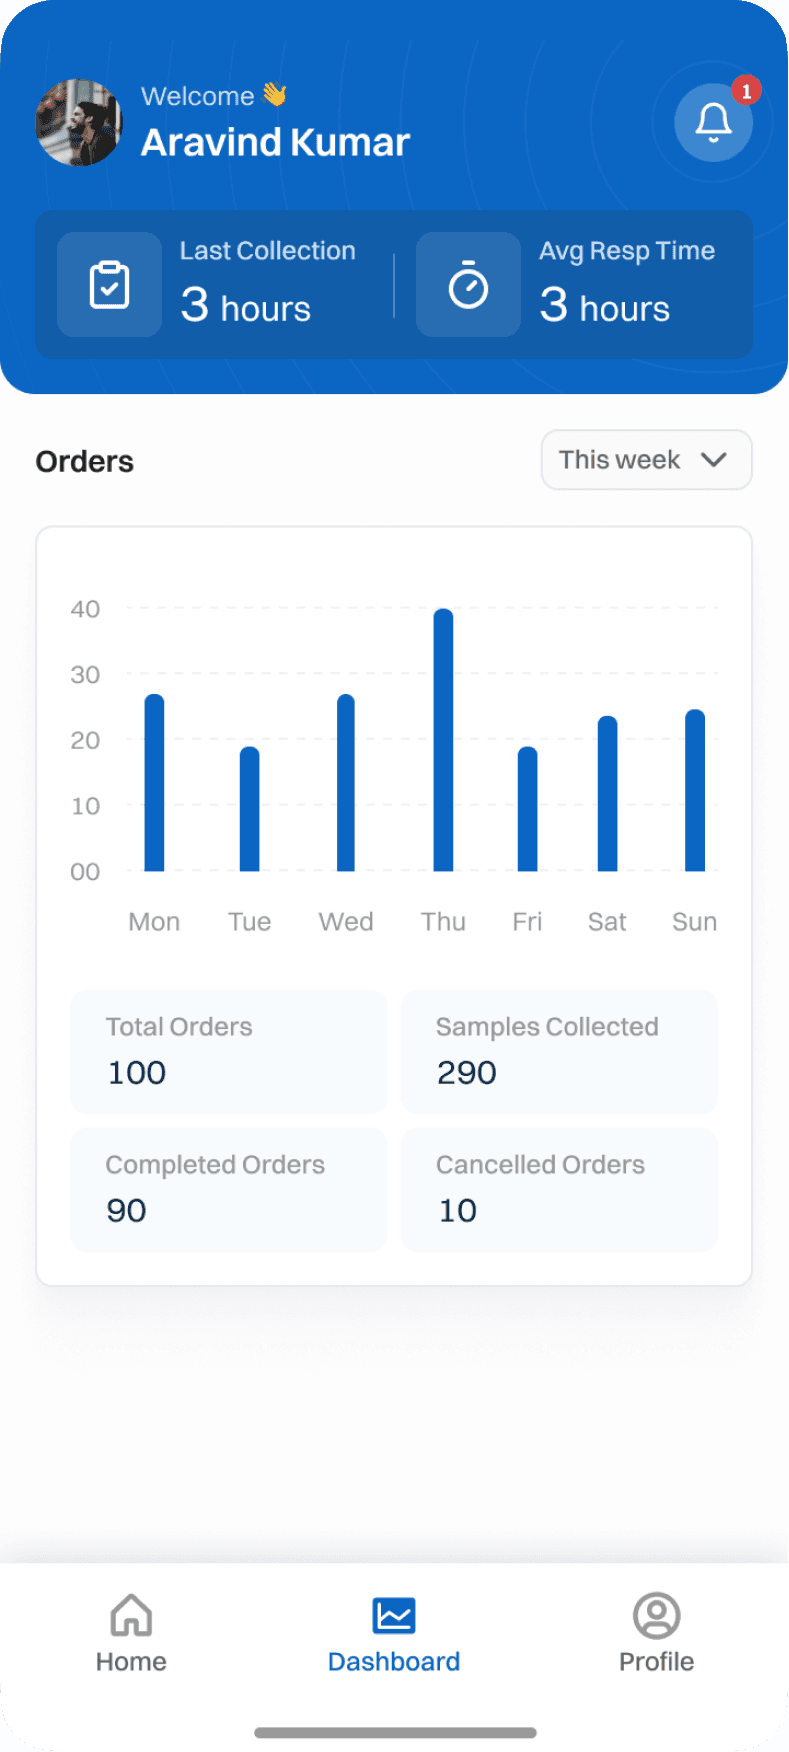
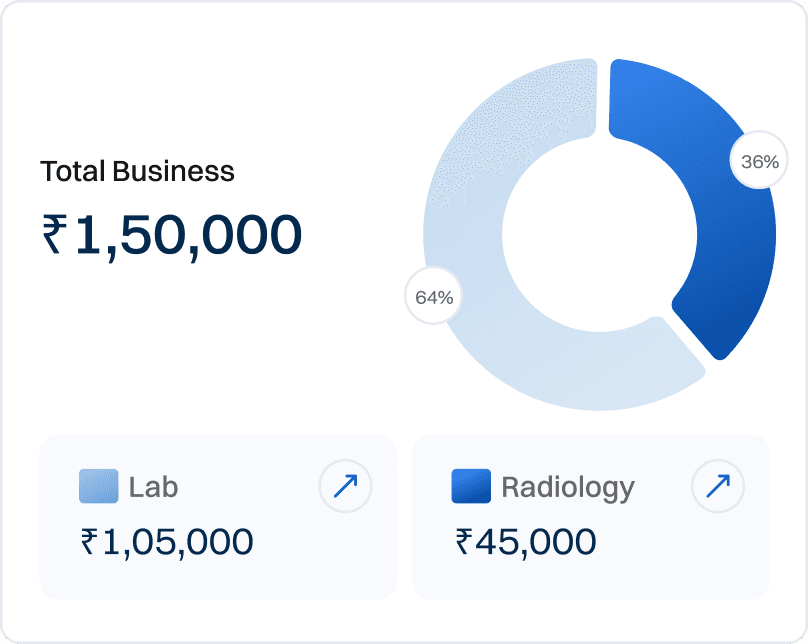
Track your Earnings
Track your Earnings
Quick overview of total earnings with lab and radiology splits.
Quick overview of total earnings with lab and radiology splits.
20+ Customized Icons
Created by ainul muttaqin
from the Noun Project
Created by ainul muttaqin
from the Noun Project
Created by Evon
from the Noun Project
Designed to give users immediate visual clarity.
Track your Earnings
Quick overview of total earnings with lab and radiology splits.
All in one app
To book tests, upload prescriptions, manage family profiles, track phlebo visits, view reports
Visual Cues for the Entire Delivery Journey
Each Icons highlight every order status, making progress easy to track.
Track Test Status Effortlessly
Easily view each client’s pending and completed test details instantly.
Fixing Key Interface Elements for Faster, Smarter Use
Fixing Key Interface Elements for Faster, Smarter Use
Fixing Key Interface Elements for Faster, Smarter Use
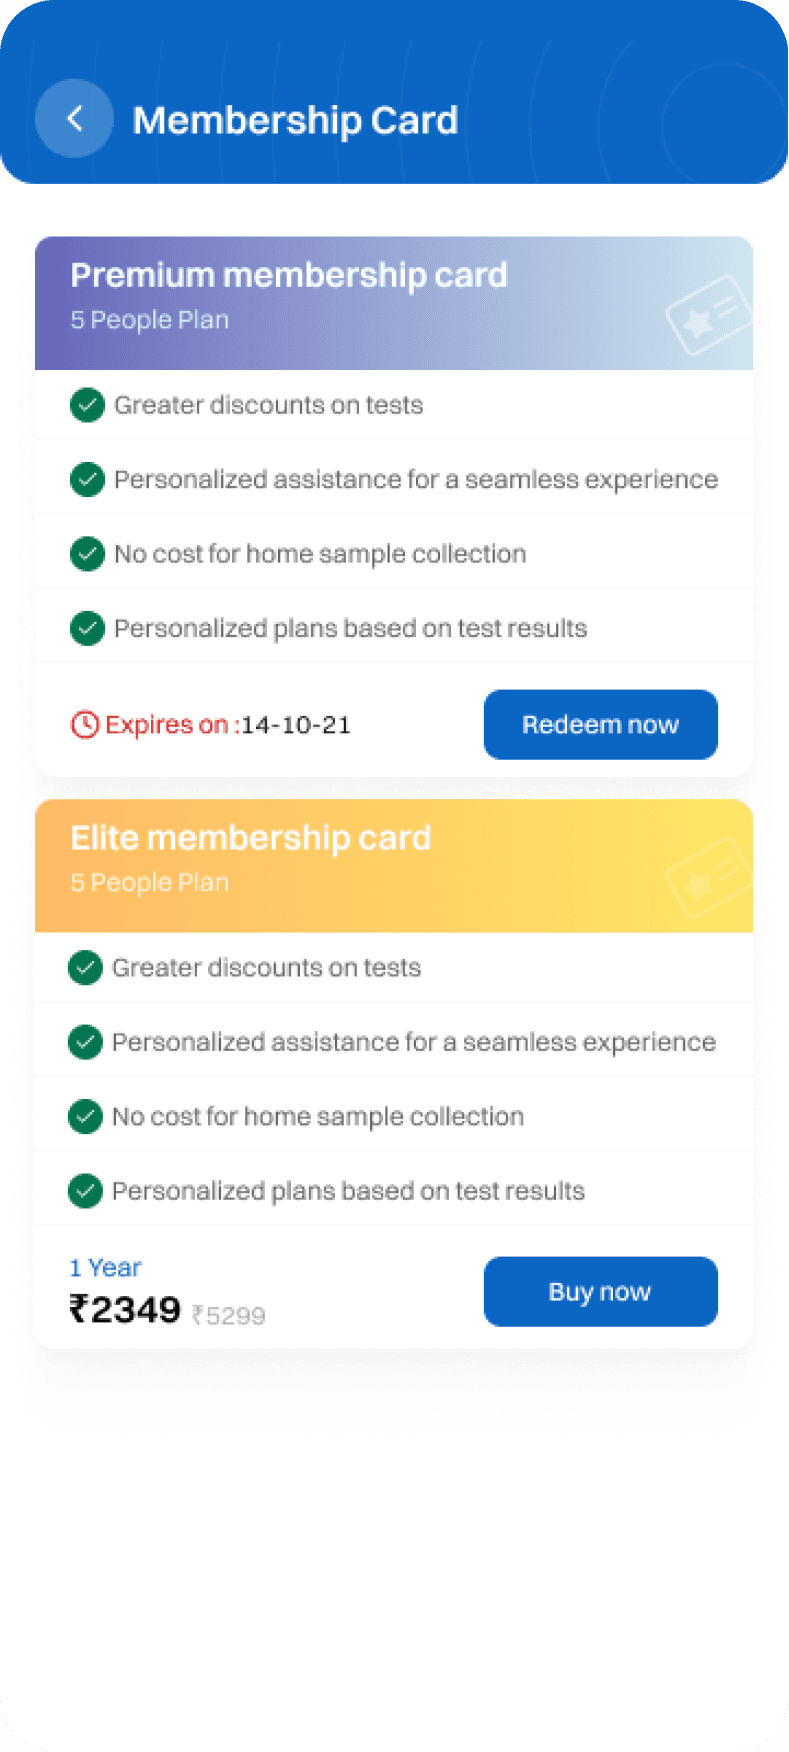
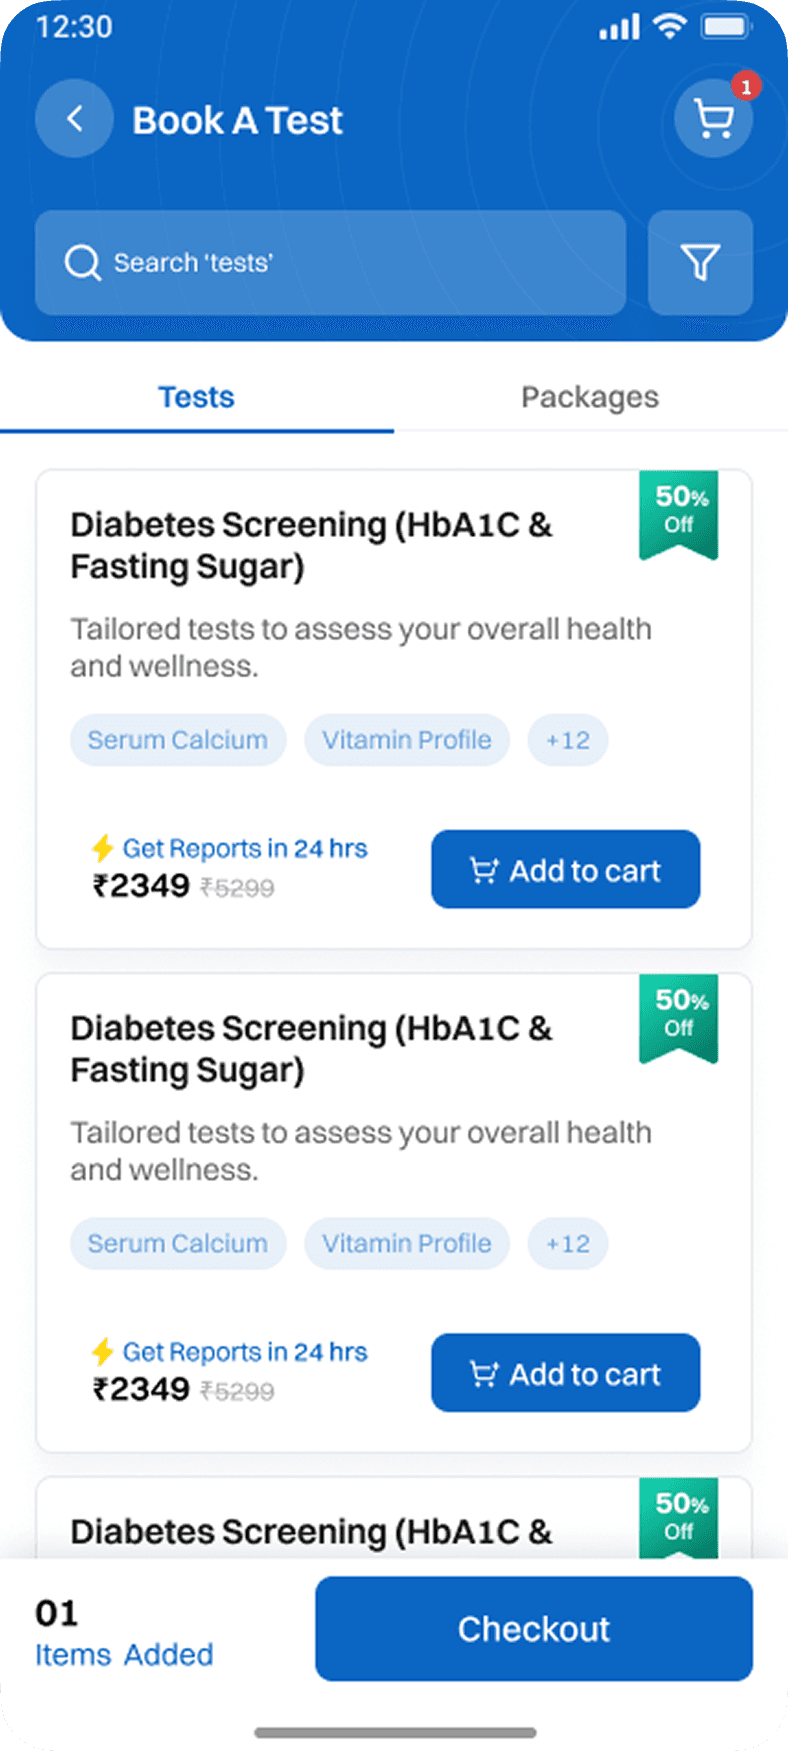
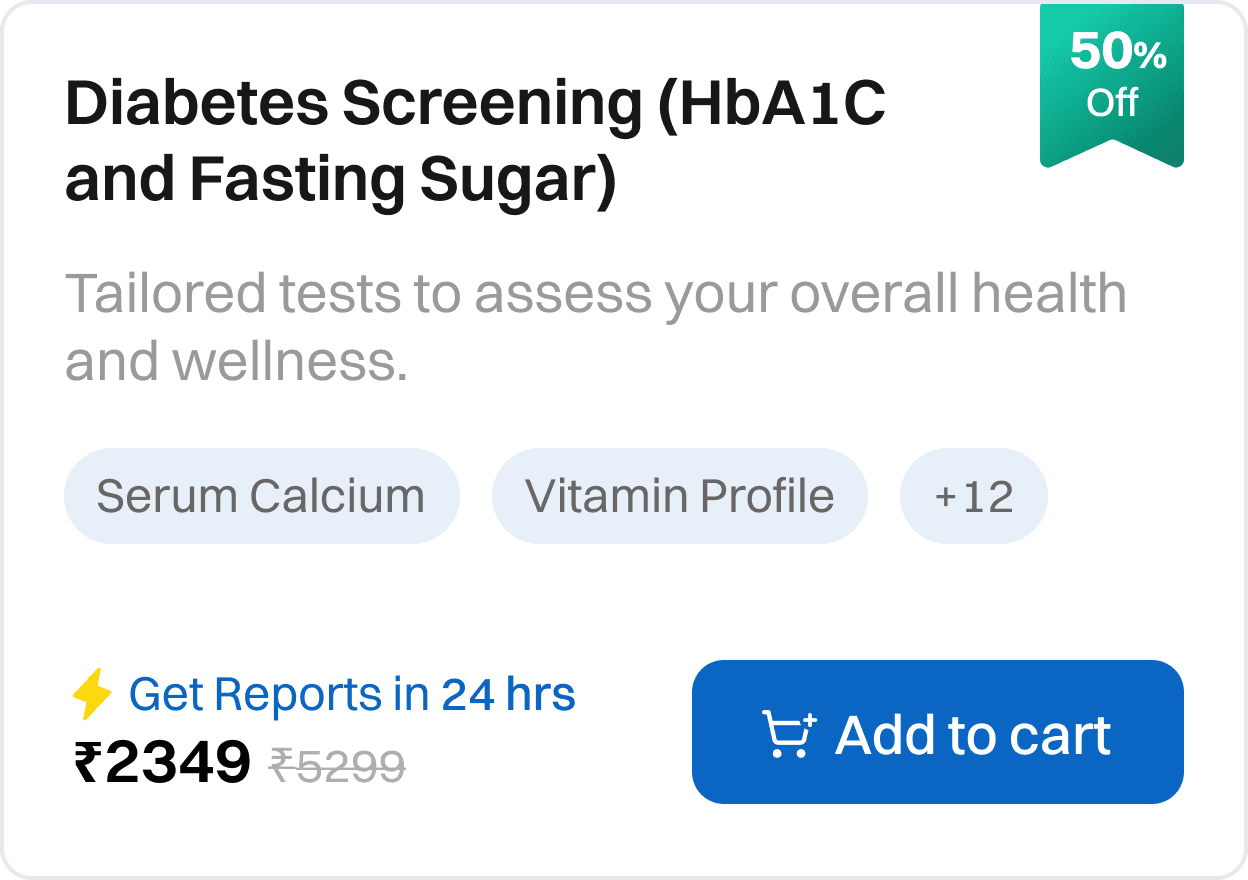
New Health check-up Service Card
New Health check-up Service Card
New Health check-up Service Card
The previous card provided almost no useful details, leading to confusion and low usage. We redesigned it with clear hierarchy and richer information to improve usability and adoption.
The previous card provided almost no useful details, leading to confusion and low usage. We redesigned it with clear hierarchy and richer information to improve usability and adoption.
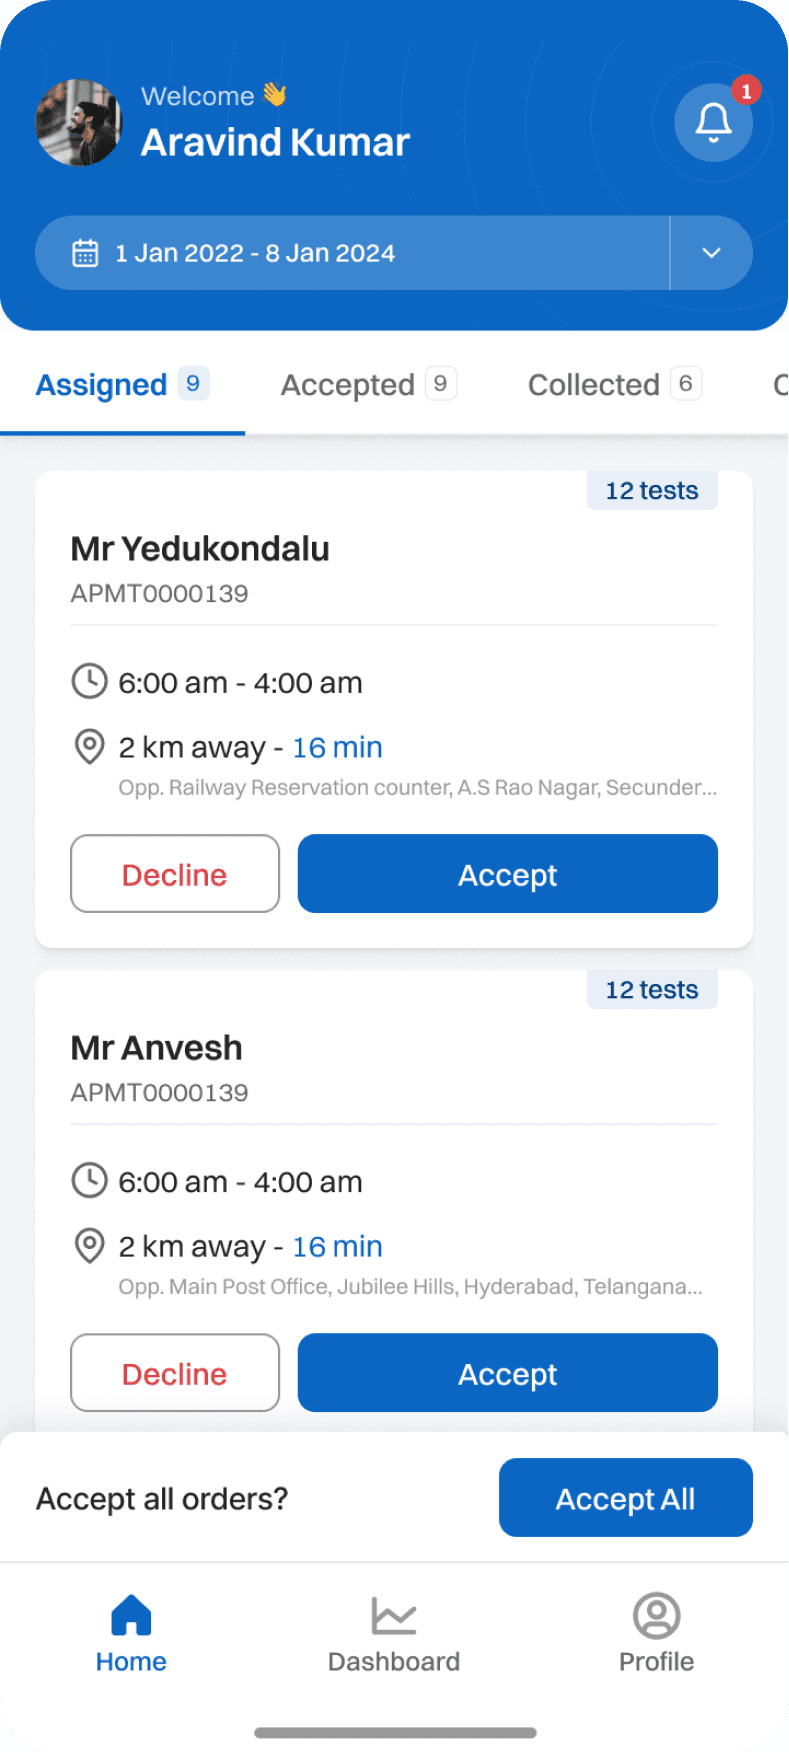
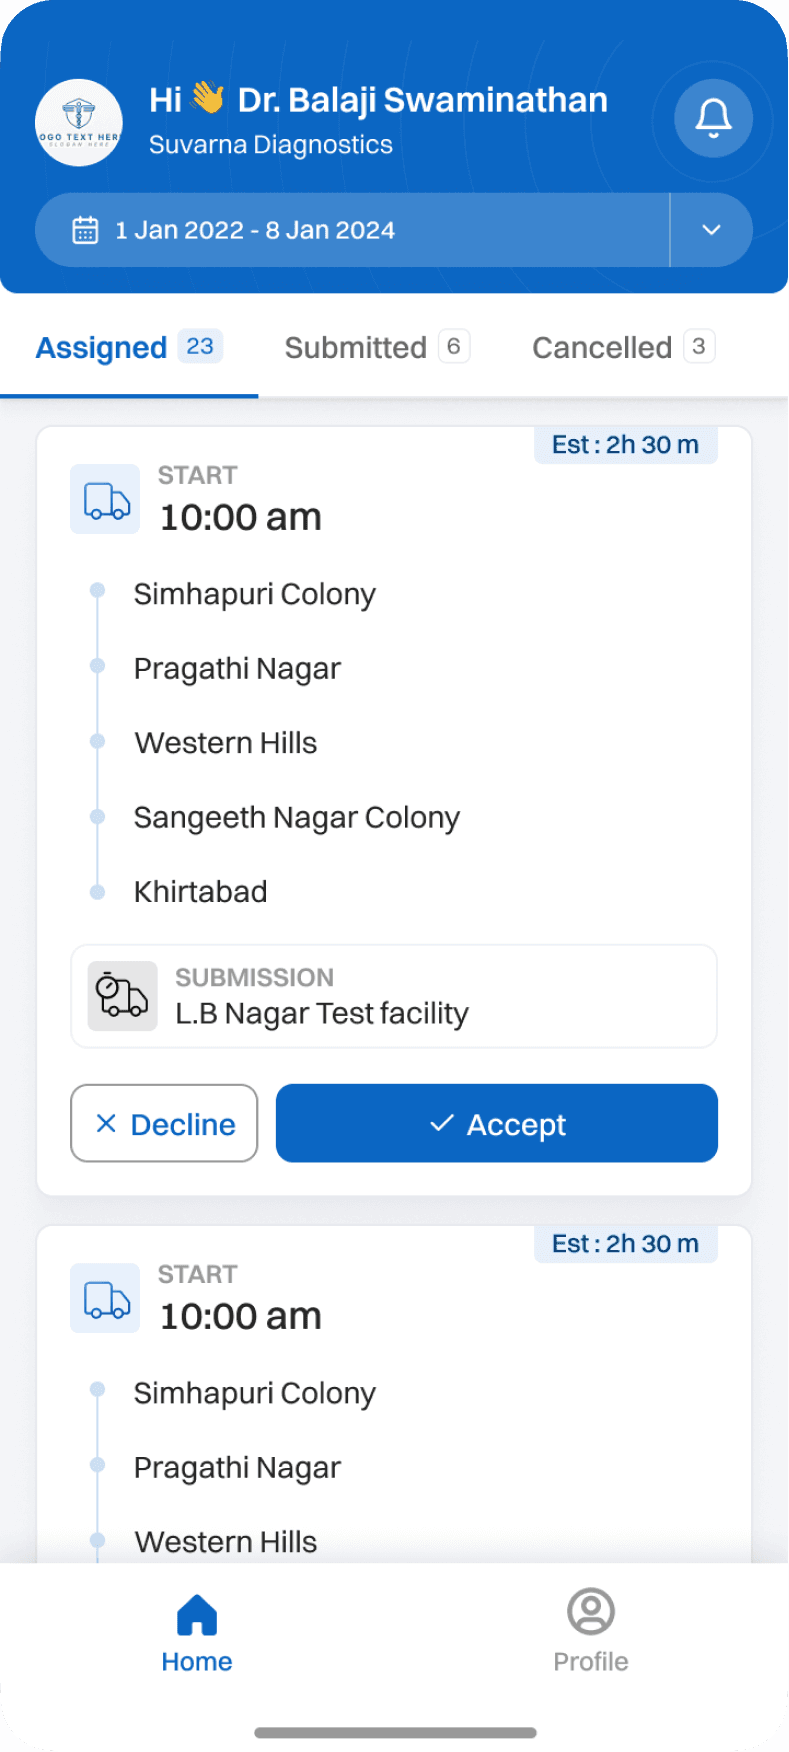
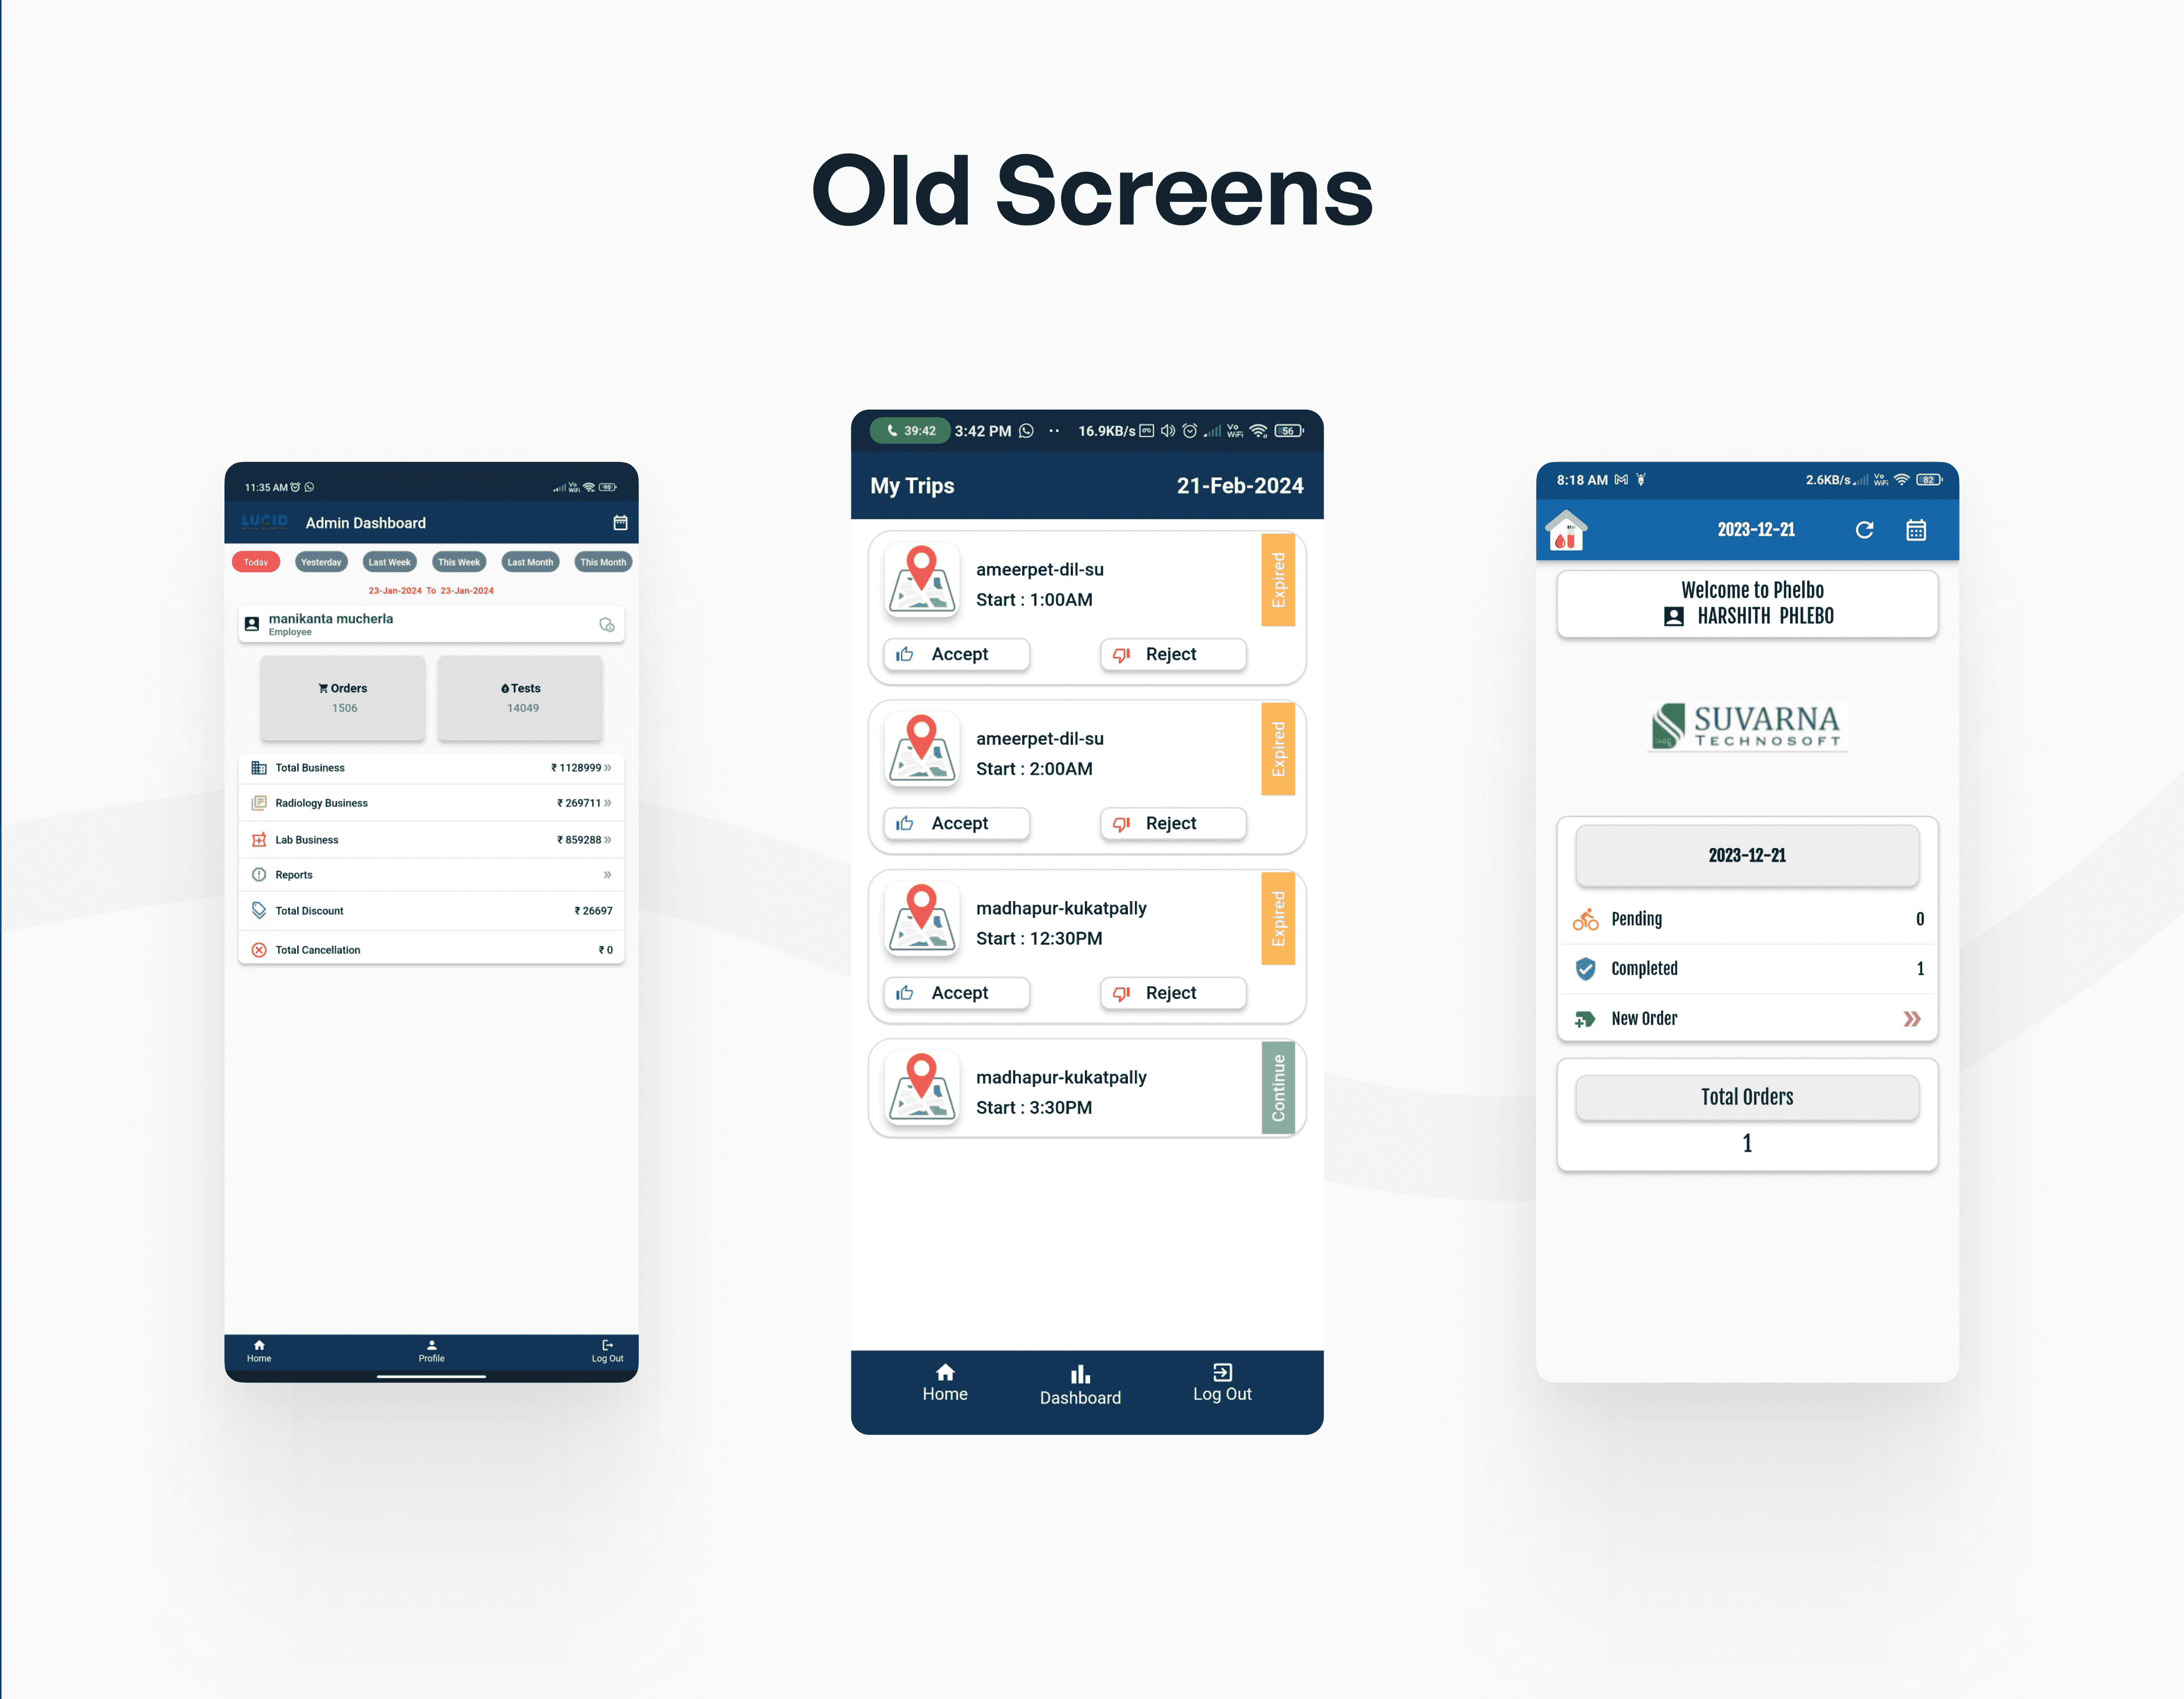
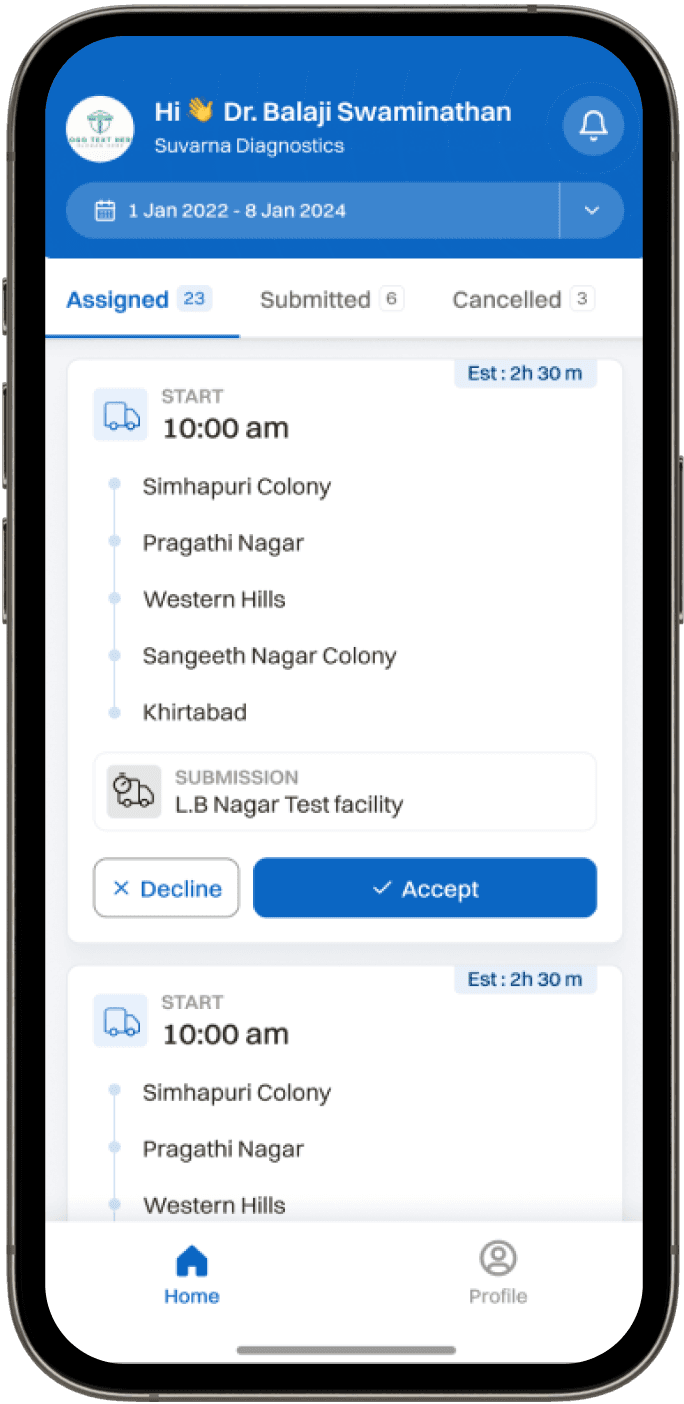
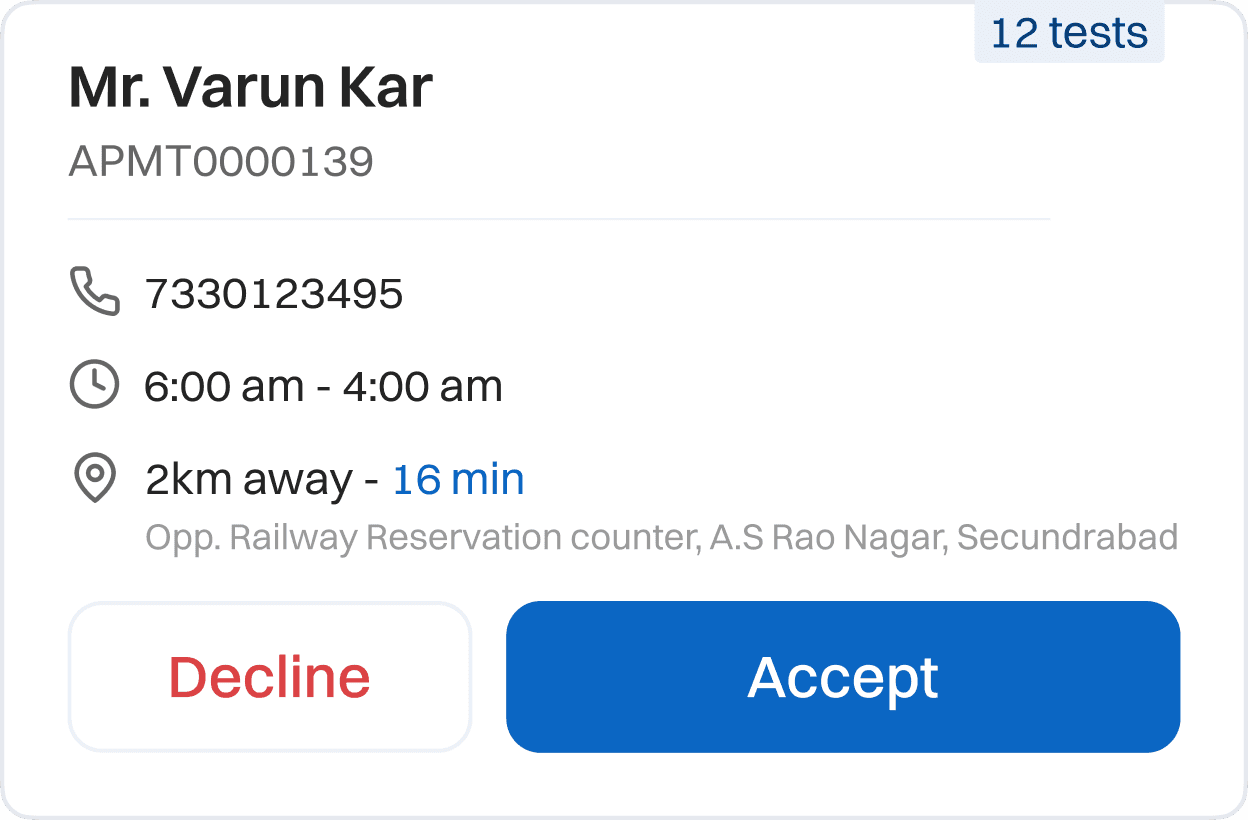
New Service request Acceptence Card
New Service request Acceptance Card
New Service request Acceptance Card
The previous card scattered essential information, slowing phlebotomists in the field. We redesigned it with clear hierarchy and key details to support faster, more reliable acceptance decisions.
The previous card scattered essential information, slowing phlebotomists in the field. We redesigned it with clear hierarchy and key details to support faster, more reliable acceptance decisions.
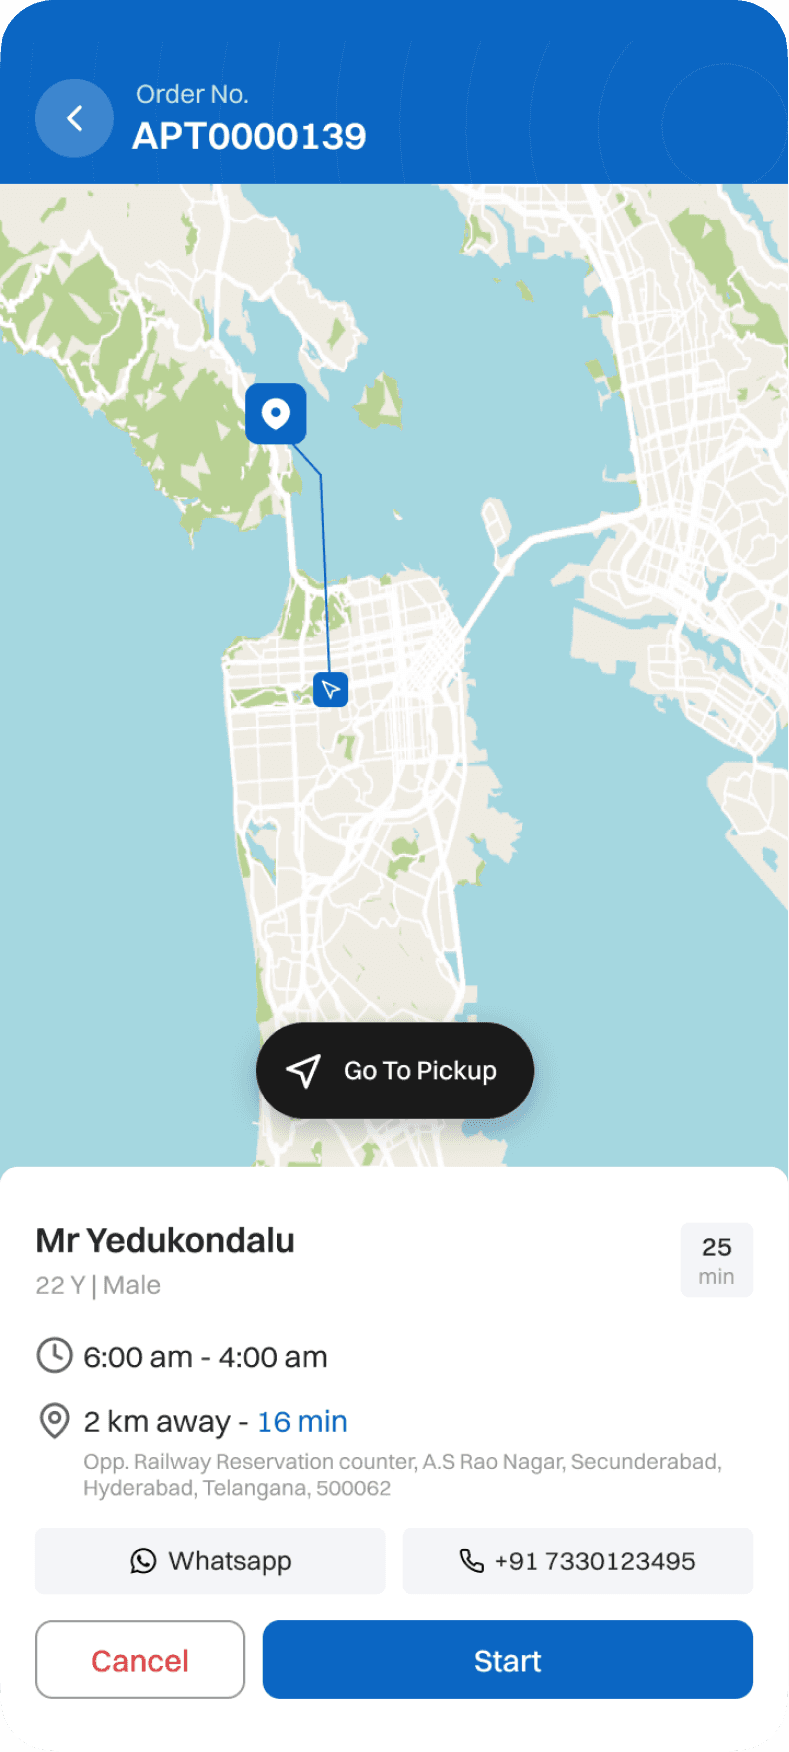
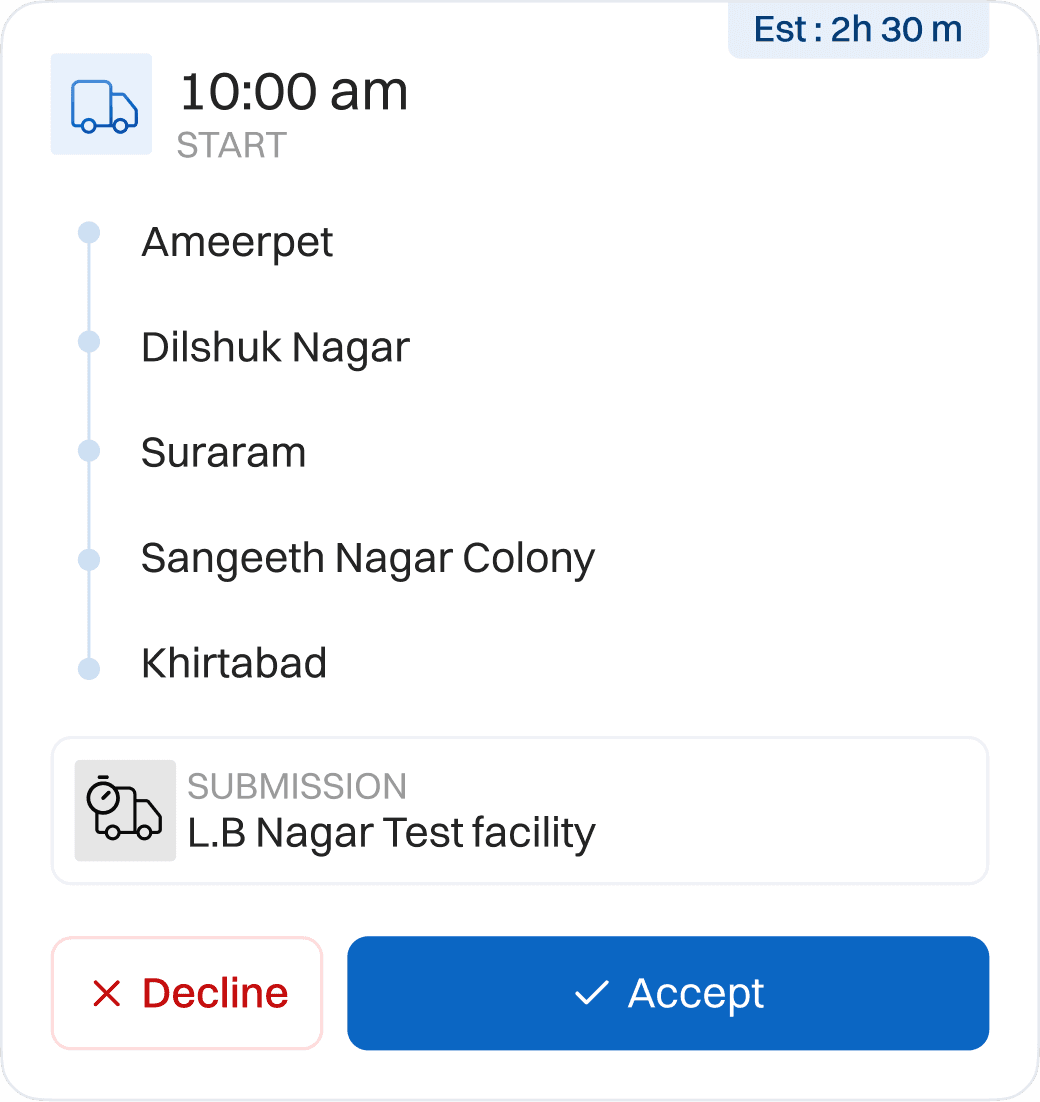
New Pickup Request Card
New Pickup Request Card
New Pickup Request Card
The Previous card hid critical details and slowed decisions; we redesigned it with clear hierarchy, route visibility, and timing clarity for faster acceptance.
The Previous card hid critical details and slowed decisions; we redesigned it with clear hierarchy, route visibility, and timing clarity for faster acceptance.
Visuals
Visuals
Visuals
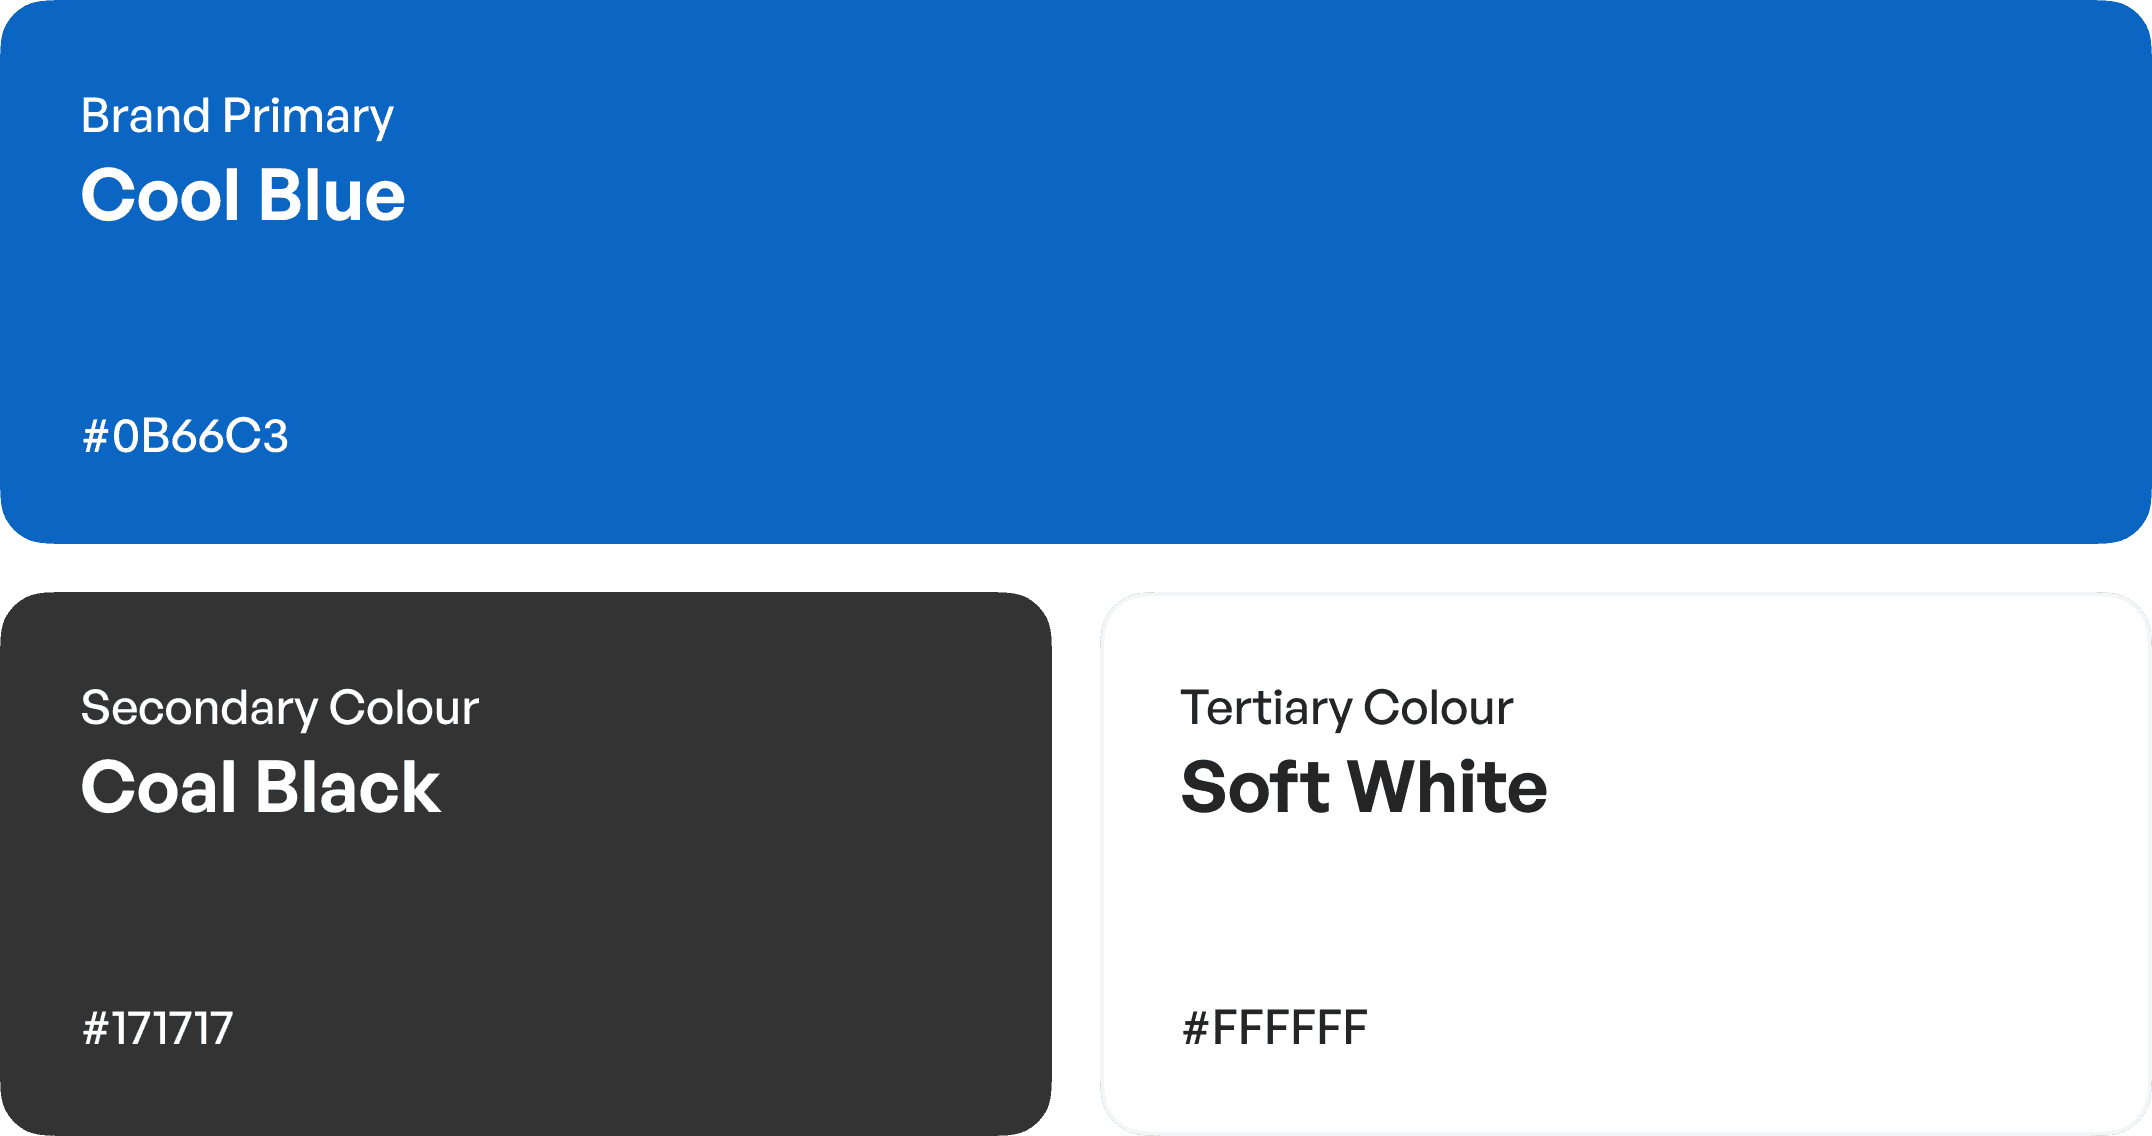
Brand Colors
Brand Colors
Type phase
Type phase
Type phase
Switzer Variable
Switzer Variable
Switzer Variable
Regular
Regular
Regular
Medium
Medium
Semi-bold
Semi-bold
Semi-bold
Bold
Bold
Bold
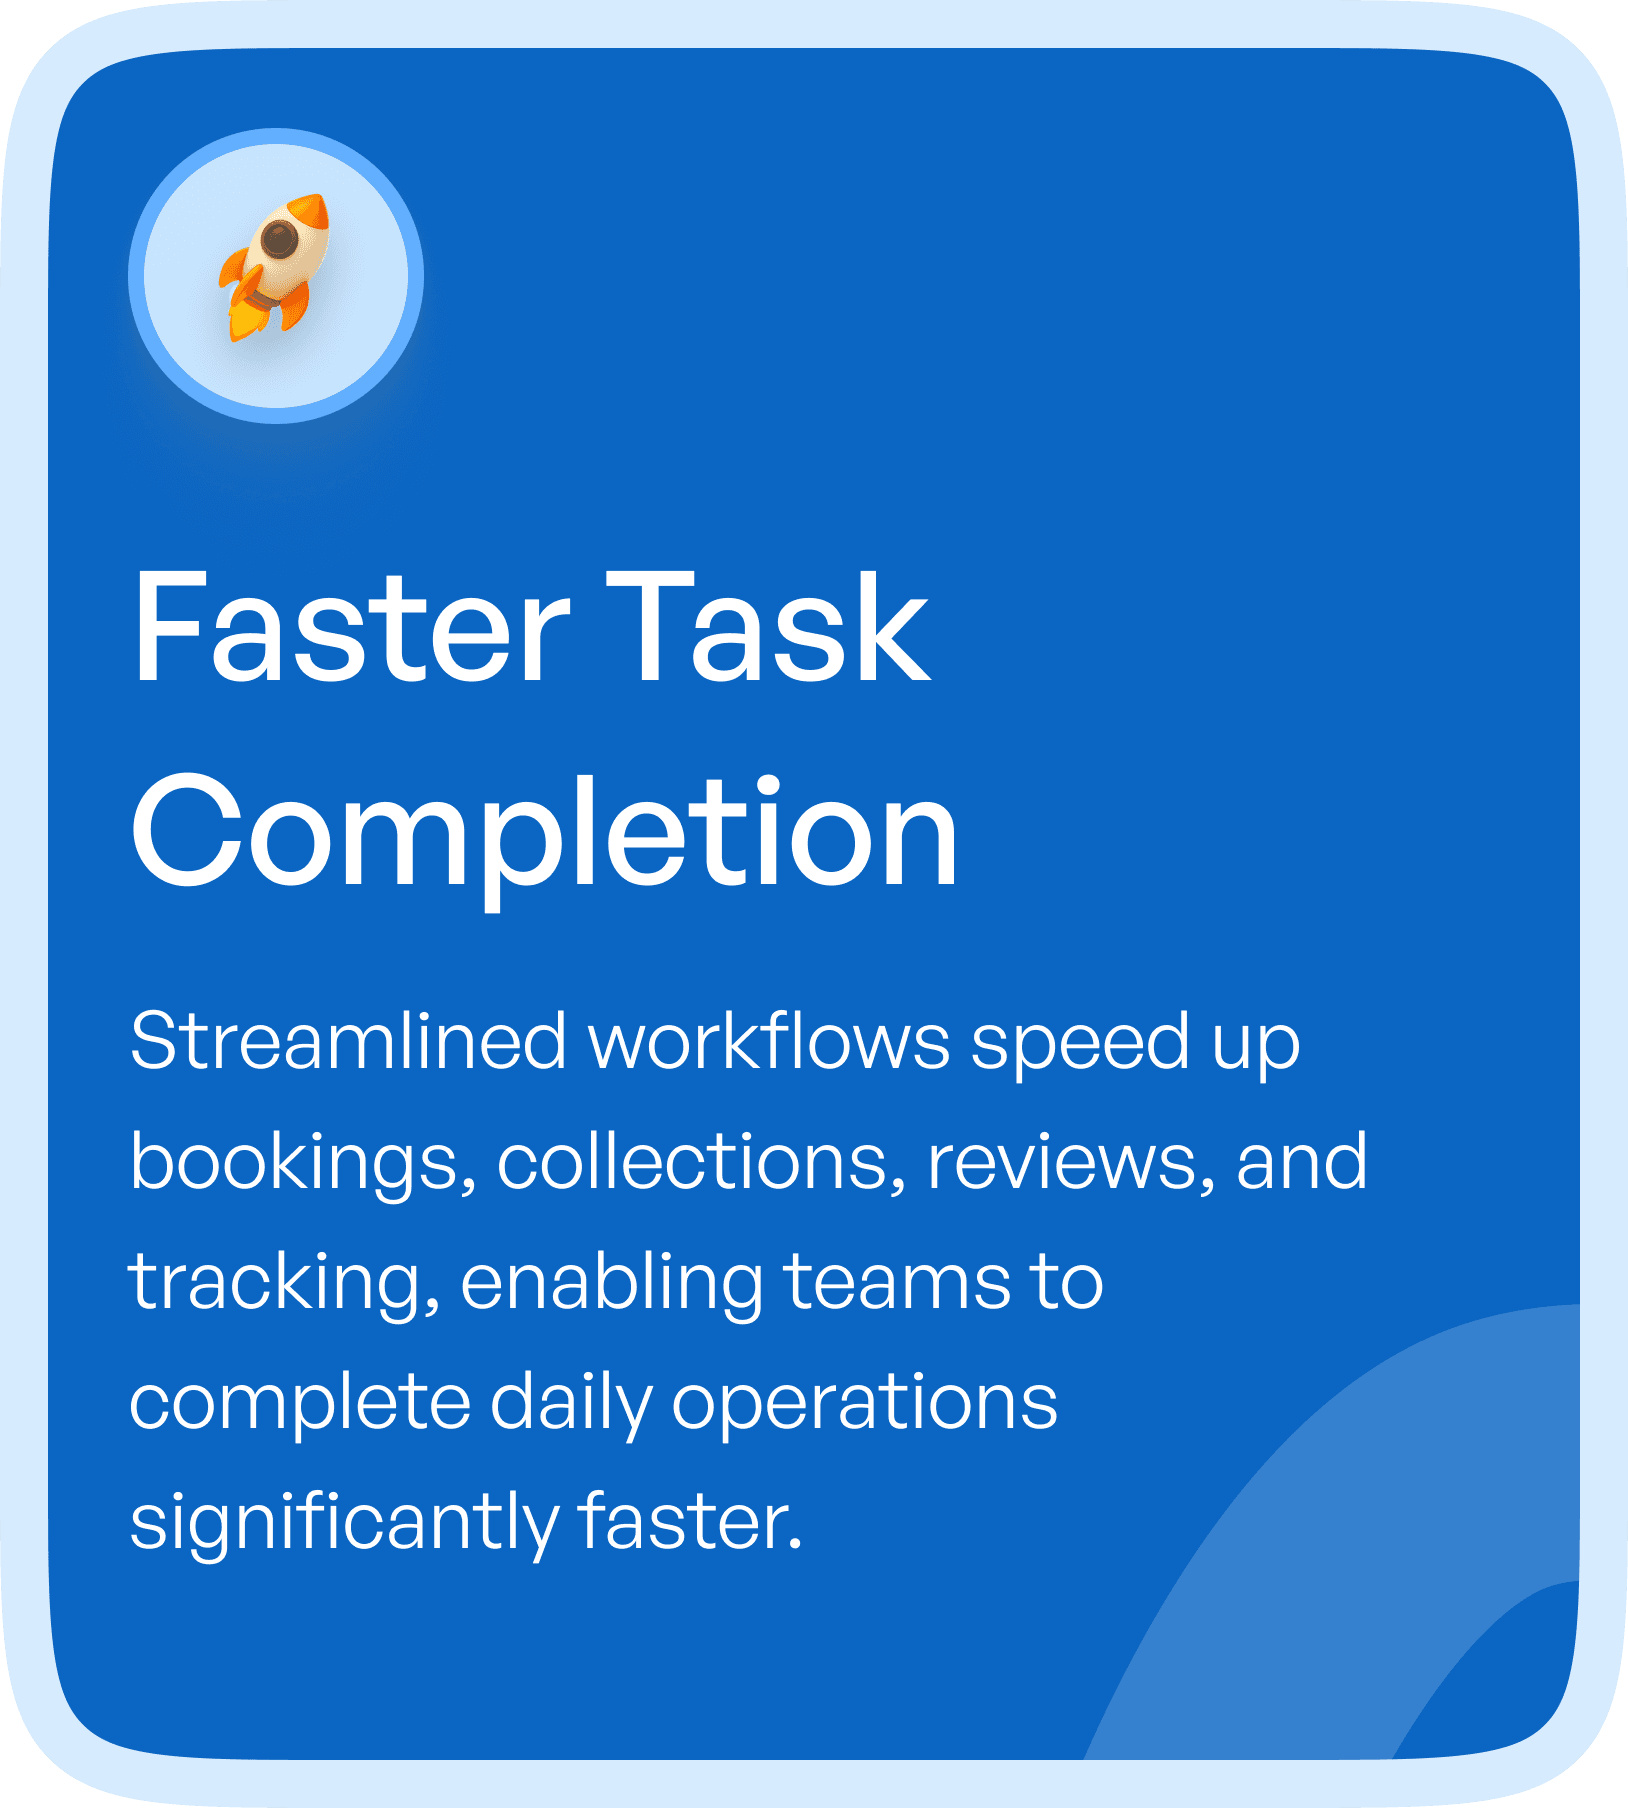
Business Impacts
Business Impacts
Business Impacts


Make your product the one users recommend!
Make your product the one users recommend!
Make your product the one users recommend!
Case Studies
Case Studies
Case Studies

Echo
Echo
Echo
AI/ML
AI/ML
AI/ML
ECHO’s cluttered dashboards and slow onboarding limited it’s growth. With role-based flows, simpler charts, and…
ECHO’s cluttered dashboards and slow onboarding limited it’s growth. With role-based flows, simpler chart…
ECHO’s cluttered dashboards and slow onboarding limited it’s growth. With role-based flows, simpler charts, and…

Suvarna
Suvarna
Suvarna
Healthcare
Healthcare
Healthcare
Six healthcare tools went from inconsistent to streamlined. With fewer screens, automation, and smart…
Six healthcare tools went from inconsistent to streamlined. With fewer screens, automation, and sma…
Six healthcare tools went from inconsistent to streamlined. With fewer screens, automation, and smart…