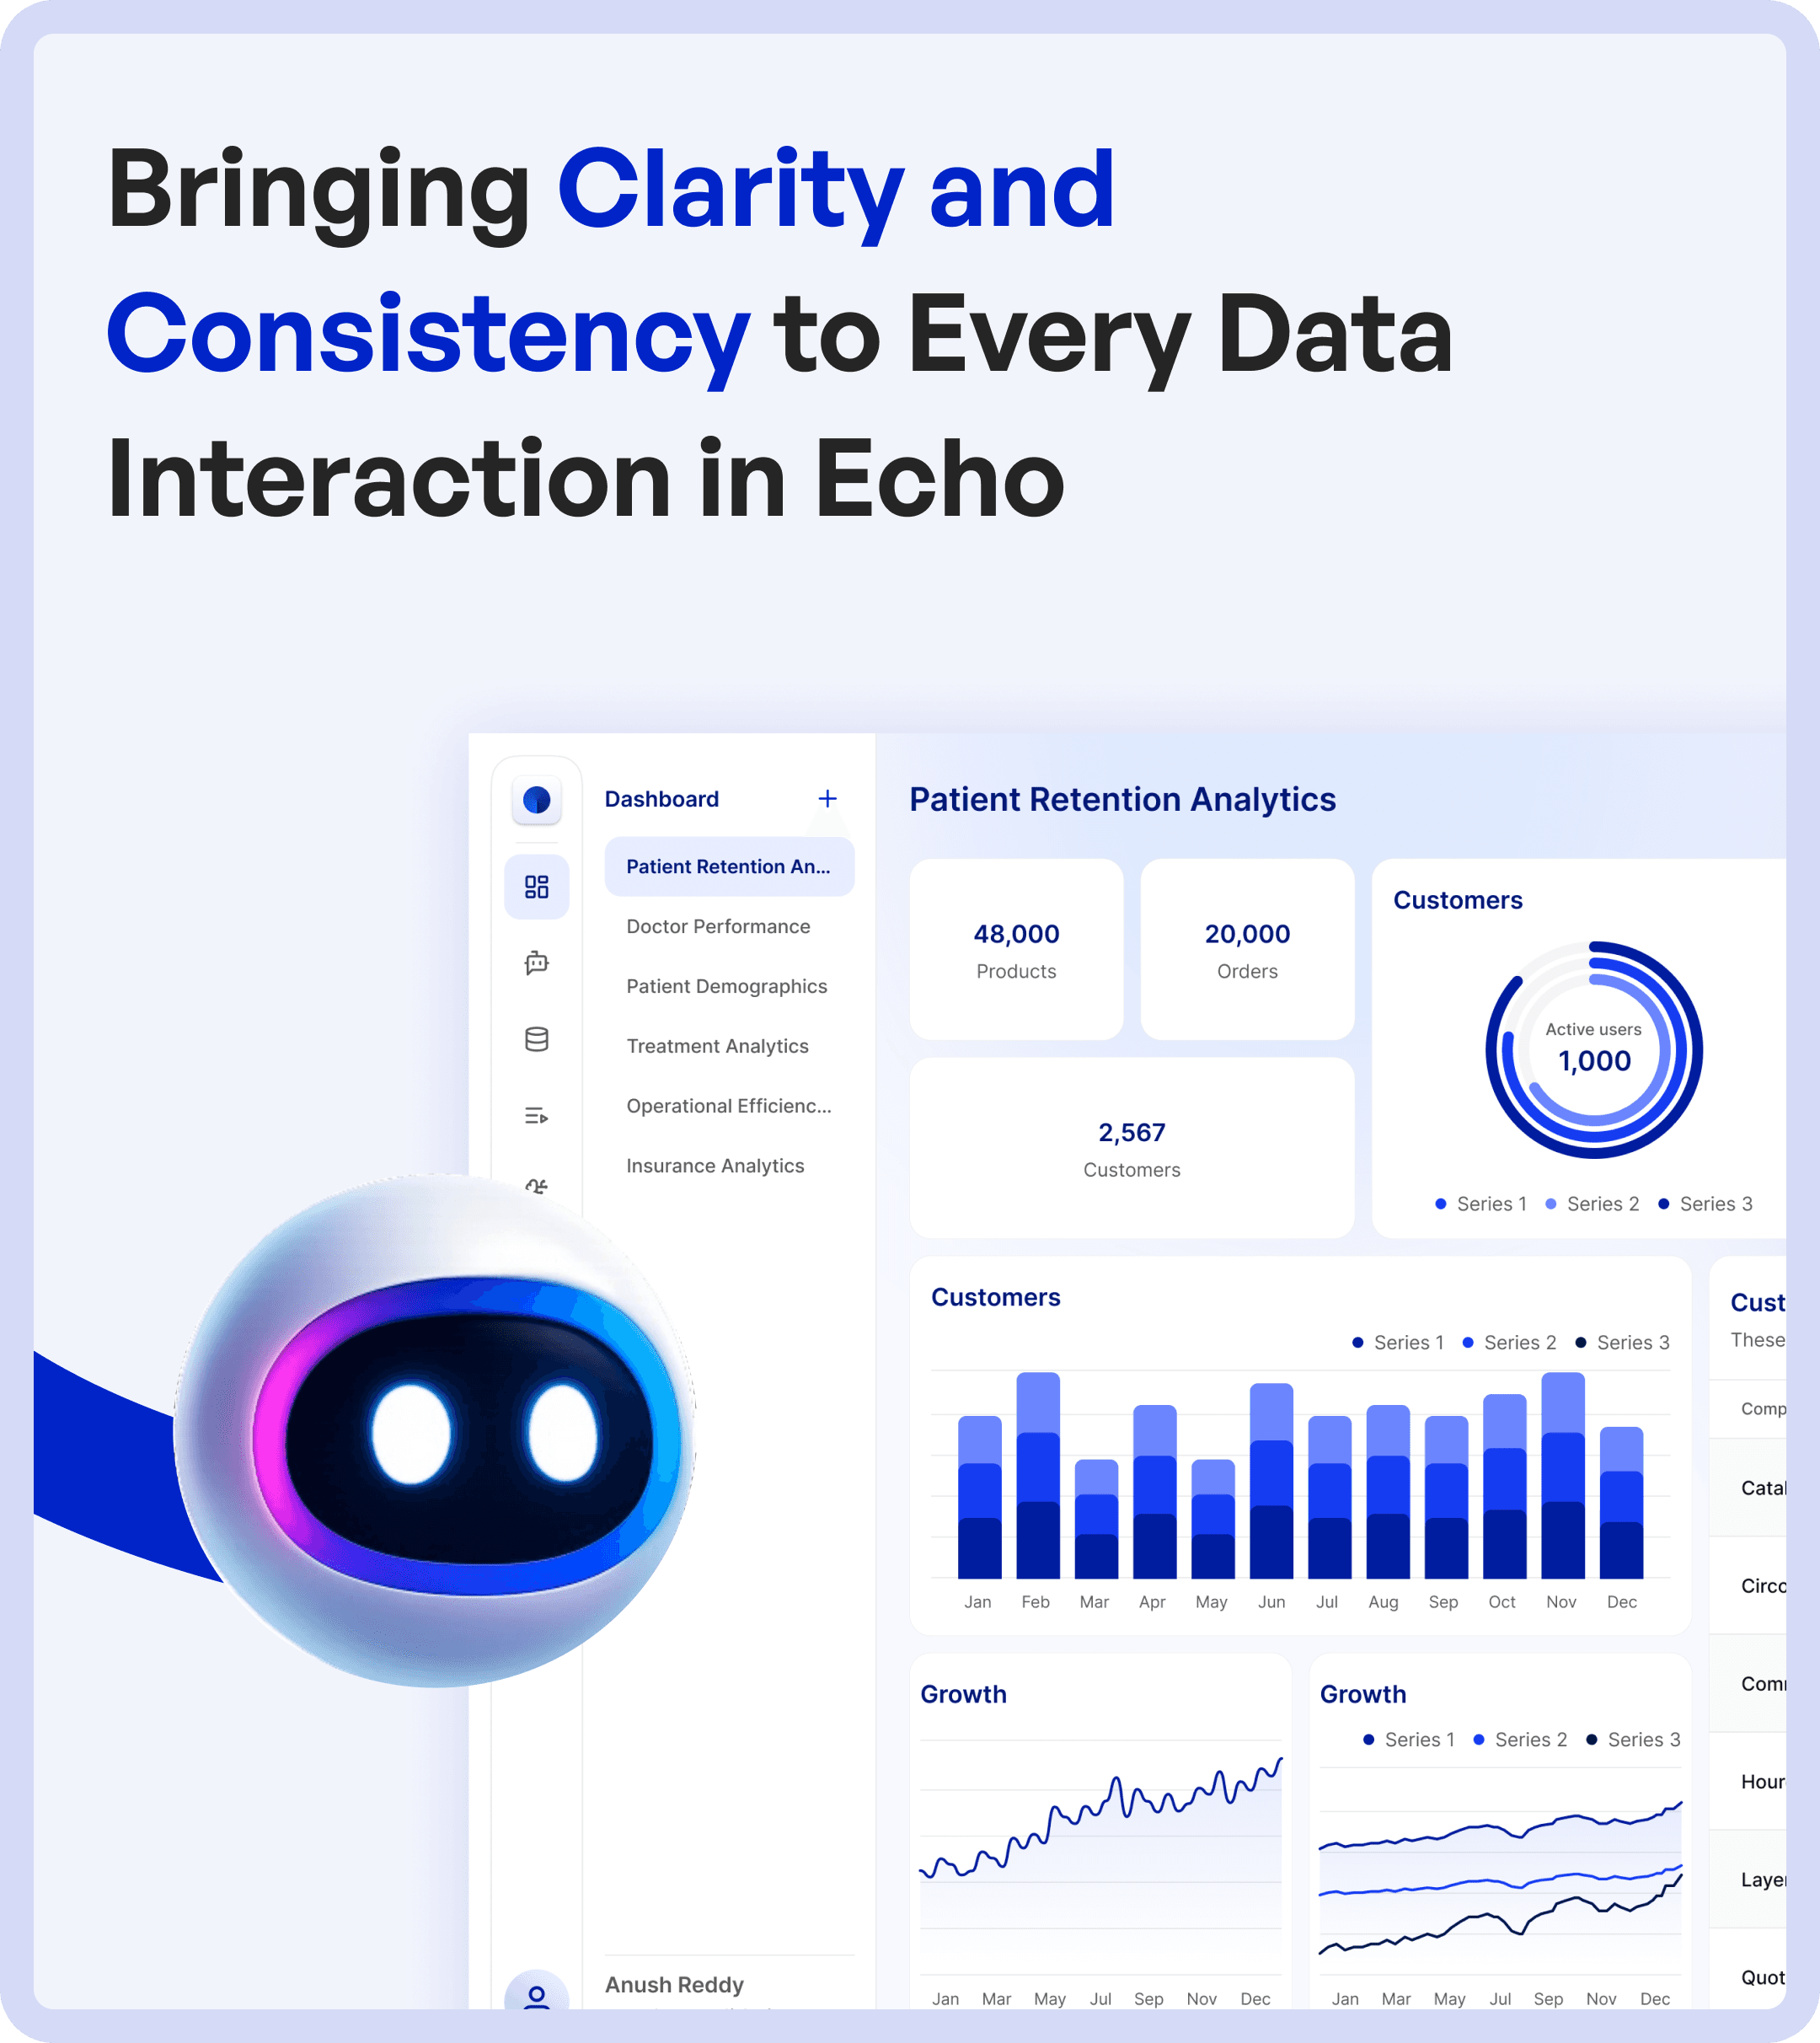

Read the project through a specific task
First-party project reference for the scope and visible artifacts: ECHO case study
Task moment | Supported project context | Design question / proposed evaluation |
|---|---|---|
Set up data context | The case presents database setup and table-mapping screens. | Can a user identify the selected data before analysis? |
Choose an interaction | Custom dashboards and chat with data are described. | Does the user understand when a direct view is preferable to a question? |
Review a result | The project shows an analytics-dashboard example. | Can the person connect a value or answer to its context? |
Change a model | Model-selection capability is described. | Does changing the model preserve a clear task context? Do not infer identical output or accuracy. |
An alternative and its tradeoff
Original design analysis: a chat-only entry can make an open question easy to begin but can obscure the stable data structure needed for comparison. A dashboard-only entry can expose repeatable measures but may constrain an unfamiliar question. Presenting their roles clearly is a design decision to evaluate, not proof that either mode is universally better.
Test a realistic discovery-to-result task with representative platform users.
Ask the person to identify the data context and any limitation they can see.
Evaluate a missing-source or unavailable-result state only against supported product behavior.
Do not treat a polished explanation as evidence of model correctness.
Keep intended benefits distinct from measured product outcomes.
AI interface clarity means understanding what was asked, what data was used and what still needs review.
AI-powered data platforms promise faster insights and better decision-making.
But in reality, many users struggle with:
Unclear data flows
Inconsistent system responses
Difficulty finding relevant insights
This was the challenge with ECHO.
At Upslide Design Studio, we redesigned ECHO’s experience to bring clarity, structure, and consistency to every data interaction.
Connect the interface work to priorities and outcomes with a UX strategy.
For mapping responsibility and handoffs, use enterprise user-flow guidance.
The Core Problem in AI Data Platforms
ECHO’s platform had powerful capabilities, but users found it difficult to extract value efficiently.
The core issues included:
Complex and unstructured data flows
Inconsistent AI responses across contexts
Difficulty navigating between tools and insights
As a result:
Users struggled to trust the system
Insights were hard to interpret
Decision-making slowed down
This is a common challenge in AI and data analytics UX.

Understanding User Pain Points in Data Interaction
To redesign the system, we studied how users interacted with ECHO across different scenarios.
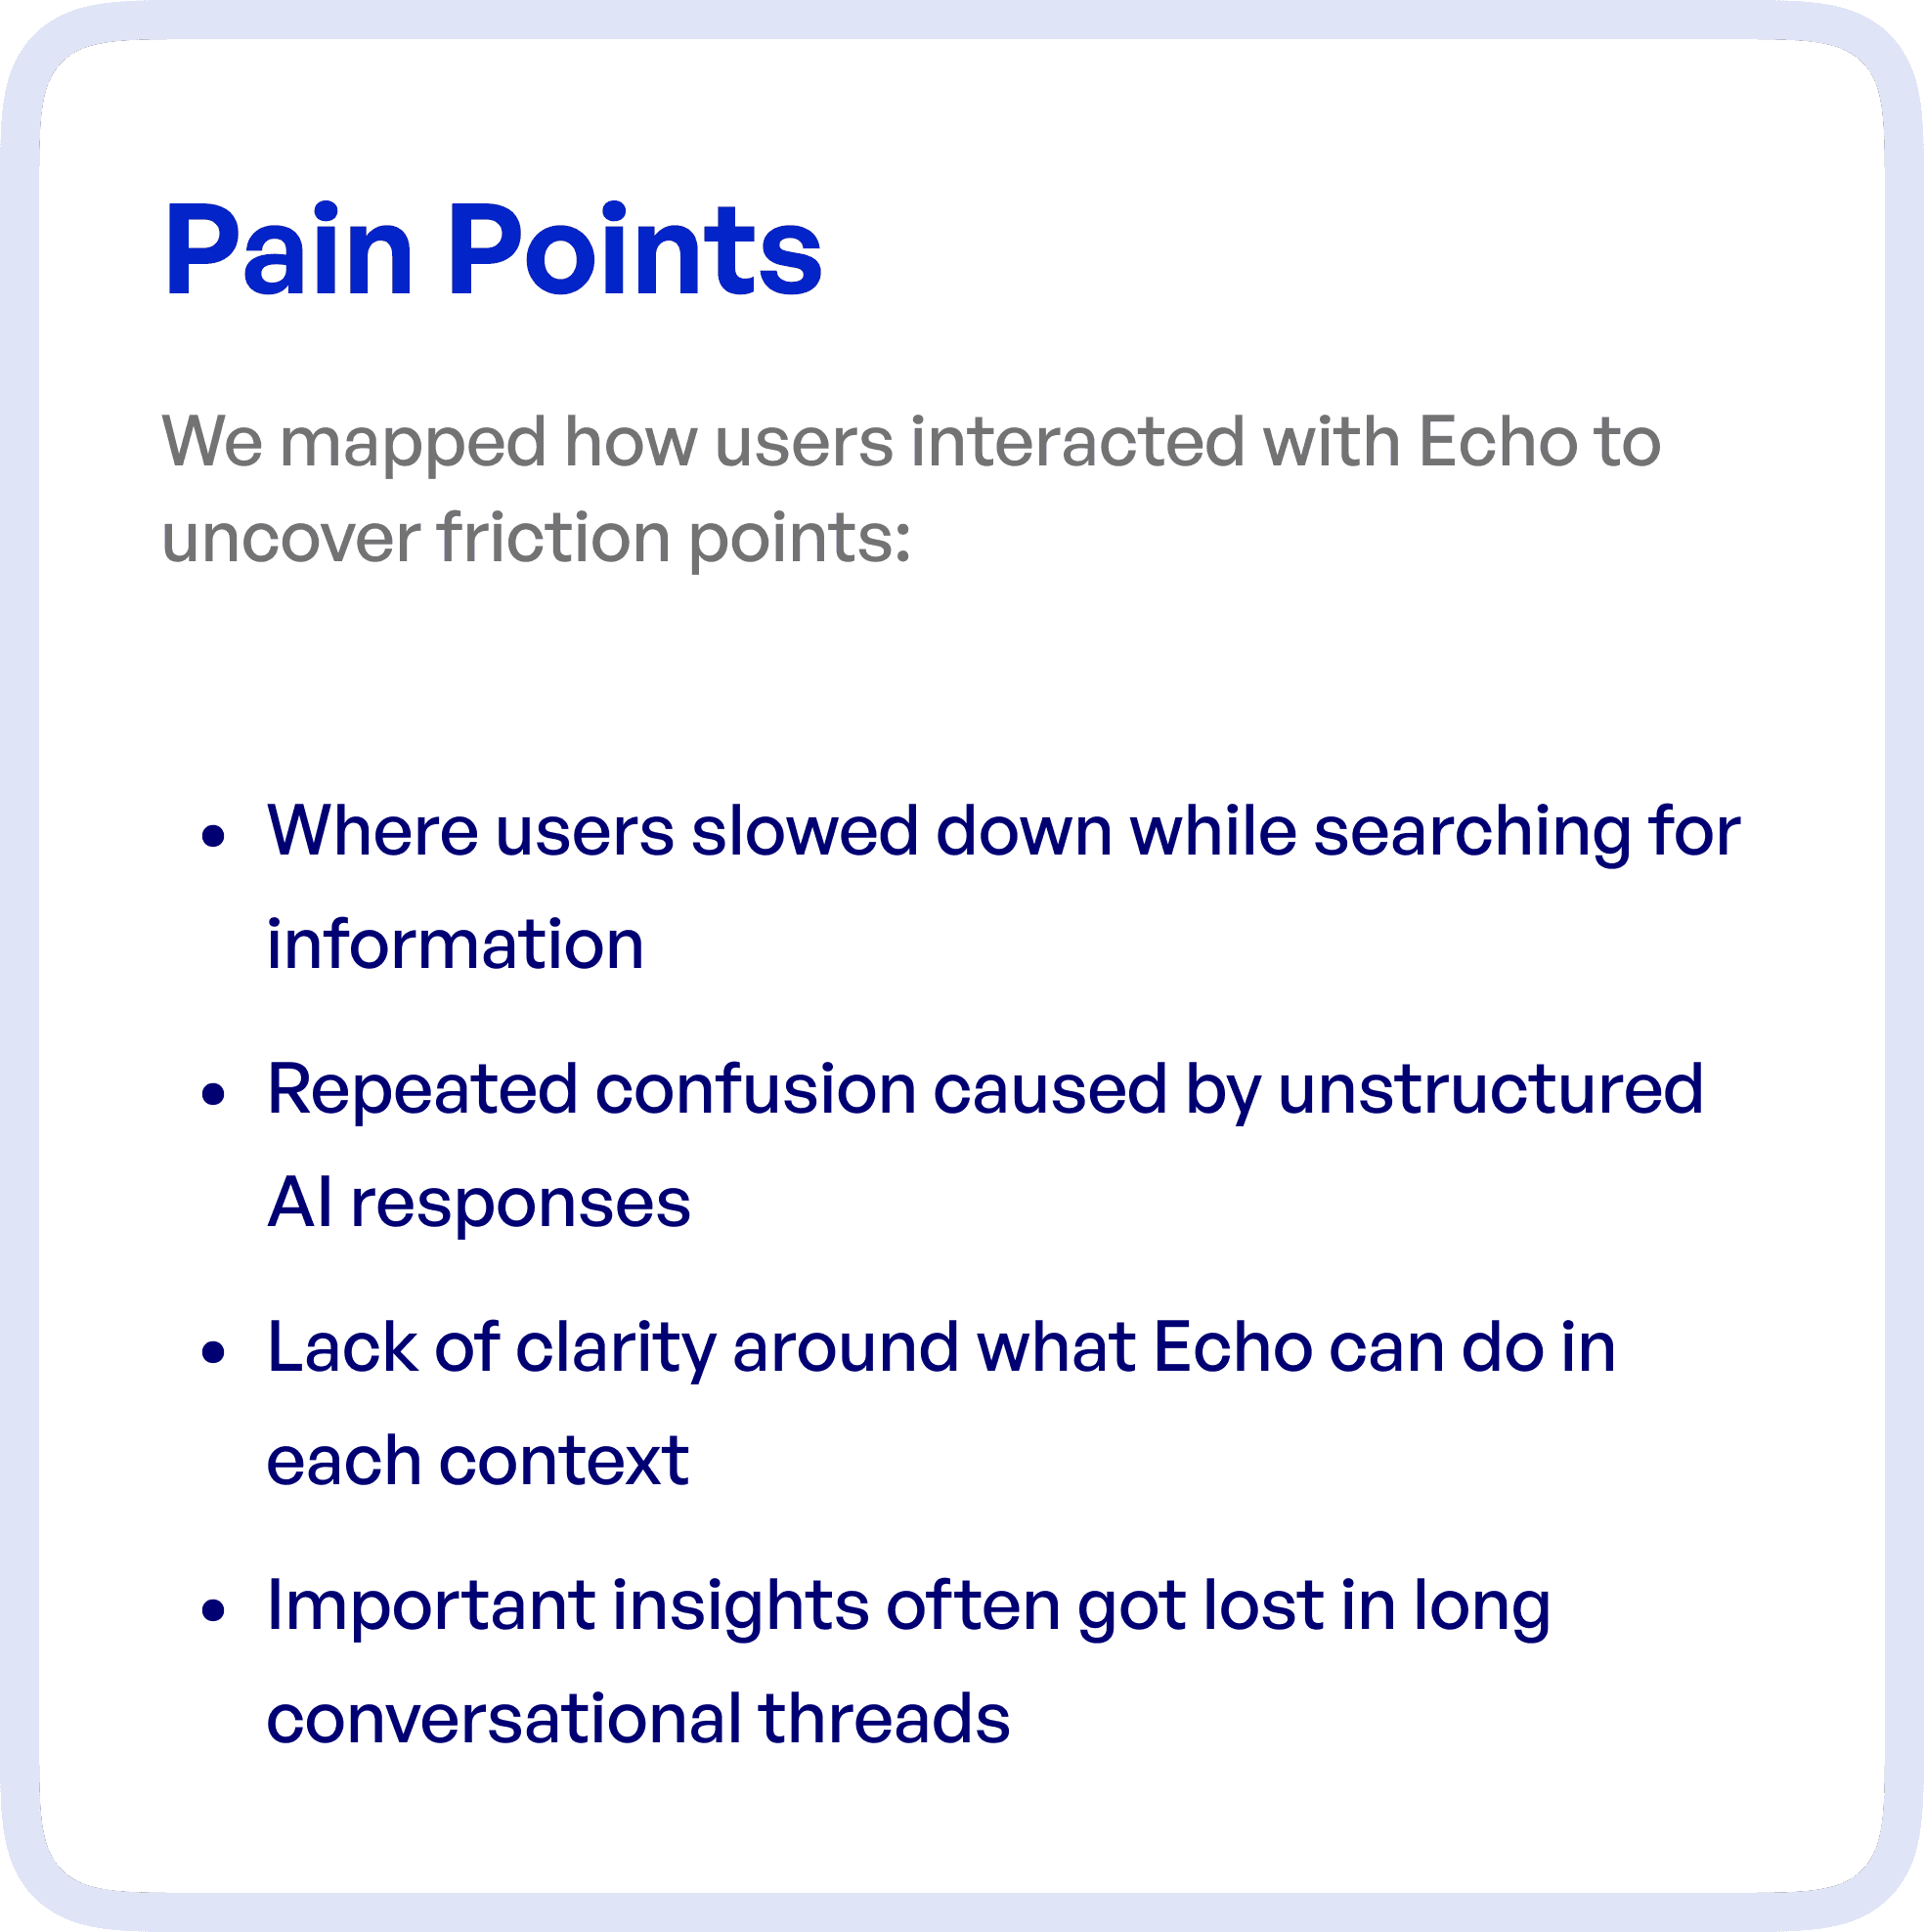
Key friction points identified:
Users slowing down while searching for specific information
Confusion caused by unstructured AI-generated responses
Lack of clarity about what actions the system supports
Important insights getting lost in long conversational threads
These issues reduced both usability and trust in the platform.
The UX Goal: Clarity and Consistency in Data Experience
The objective of the redesign was to create a system where users can:
Easily find relevant insights
Understand AI responses clearly
Navigate data workflows without confusion
The focus was on turning ECHO into a structured and predictable data interaction platform.
UX Approach: Structuring Data Flow and Interaction
Rather than redesigning isolated screens, we focused on improving the end-to-end data experience.
1. Structuring Data Flow Across the Platform
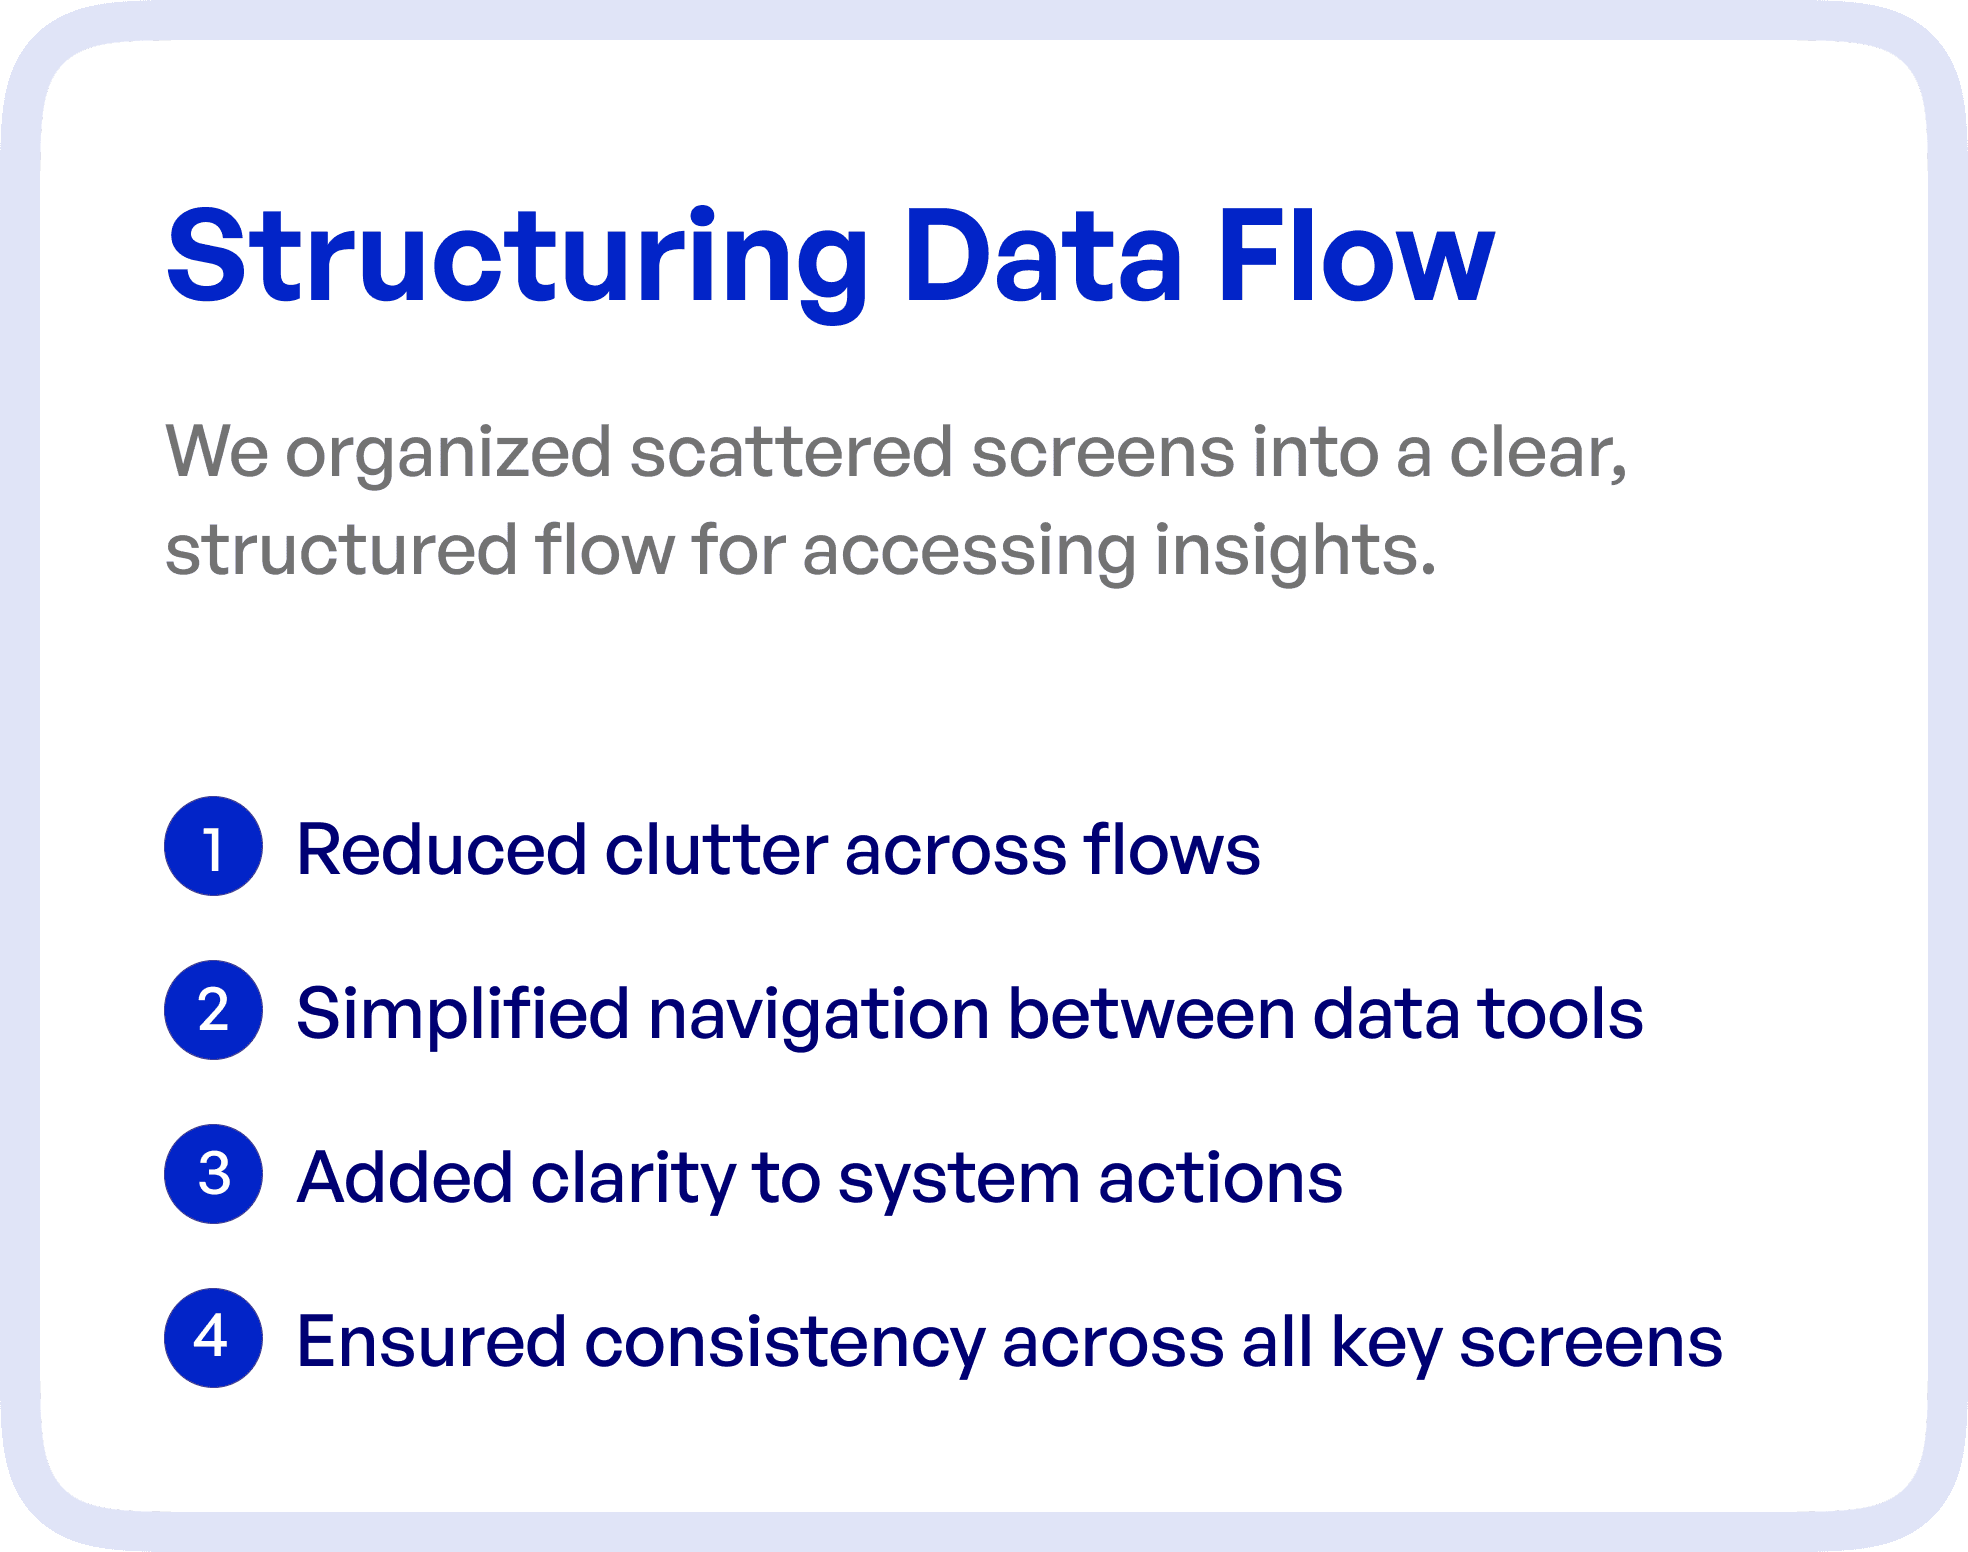
We reorganized scattered screens into a clear, connected flow.
Key improvements:
Reduced clutter across workflows
Simplified transitions between tools
Introduced structured navigation
This helped users move through the system with clarity.
2. Simplifying Navigation Between Data Tools
Users previously had to switch between multiple tools to complete tasks.
We:
Unified navigation patterns
Reduced unnecessary transitions
Created logical pathways between features
This improved efficiency and reduced friction.
3. Bringing Clarity to System Actions
One of the biggest issues in AI platforms is understanding:
“What can I do next?”
We addressed this by:
Making actions more visible
Providing contextual guidance
Clarifying system capabilities
This improved user confidence.
4. Ensuring Consistency Across Screens
Inconsistent design patterns create confusion.
We introduced:
Consistent layouts
Standardized UI components
Predictable interaction patterns
This made the system easier to learn and use.
Streamlining Data Access for Faster Insights
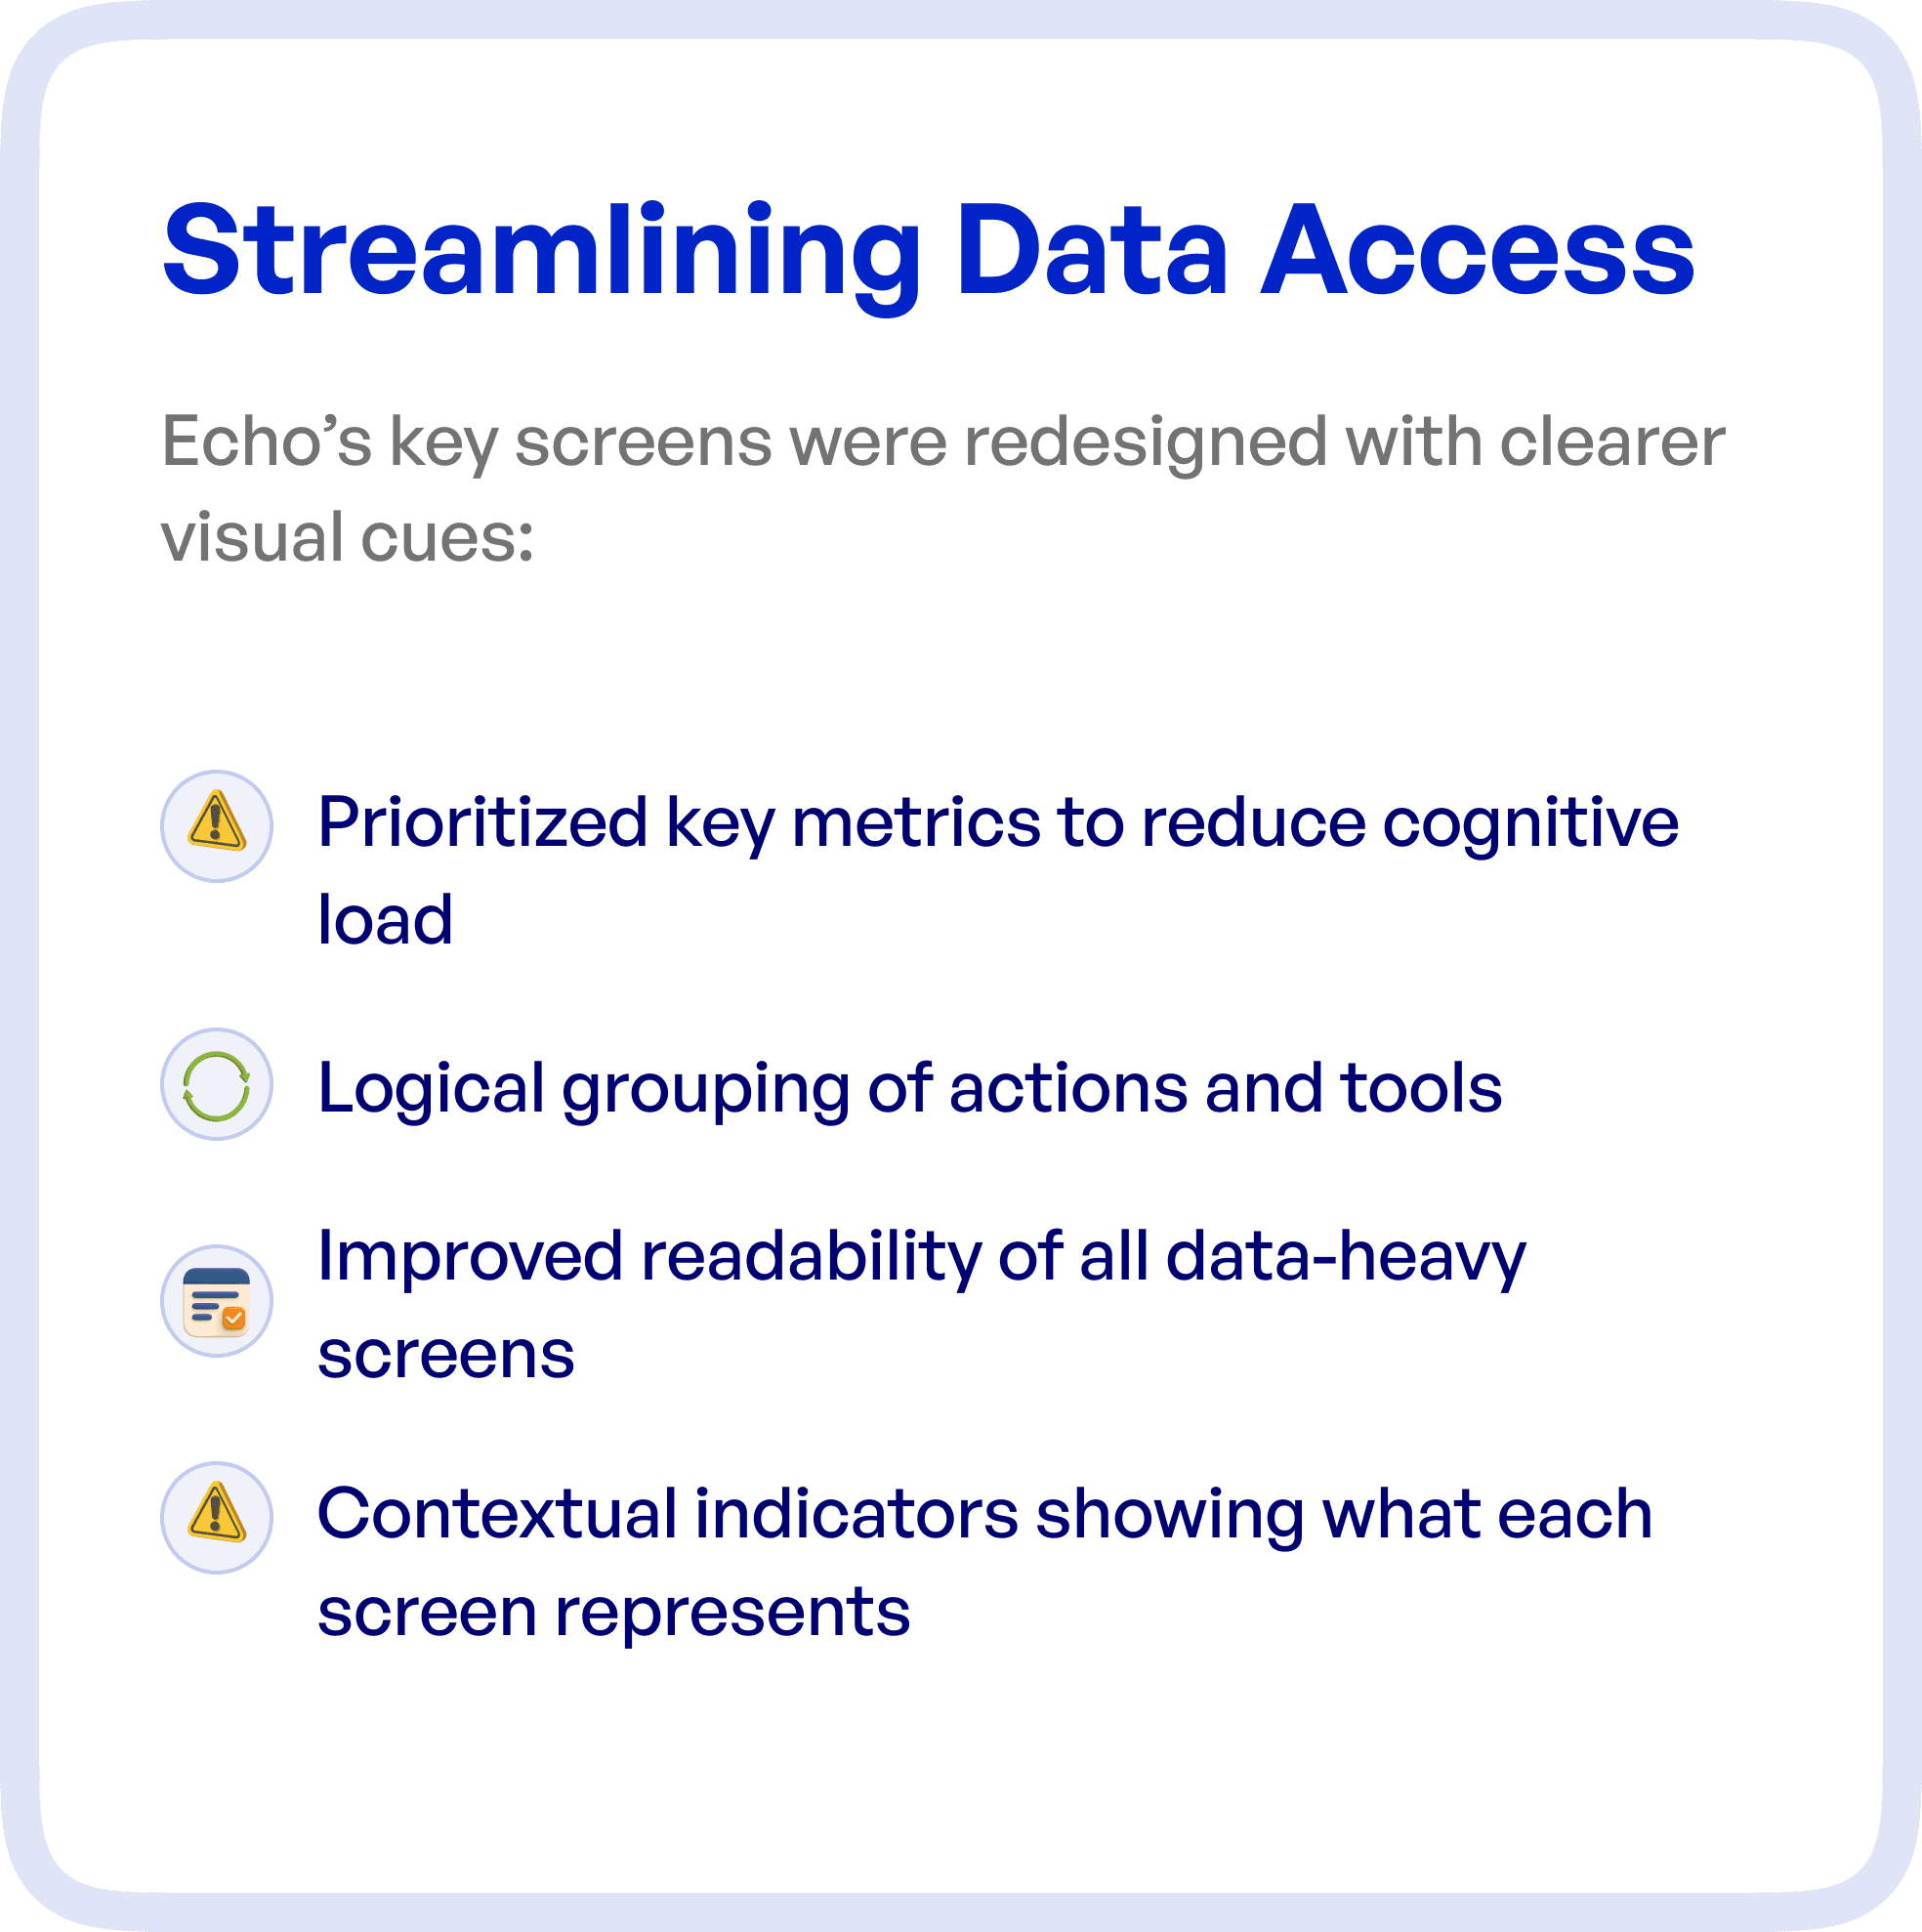
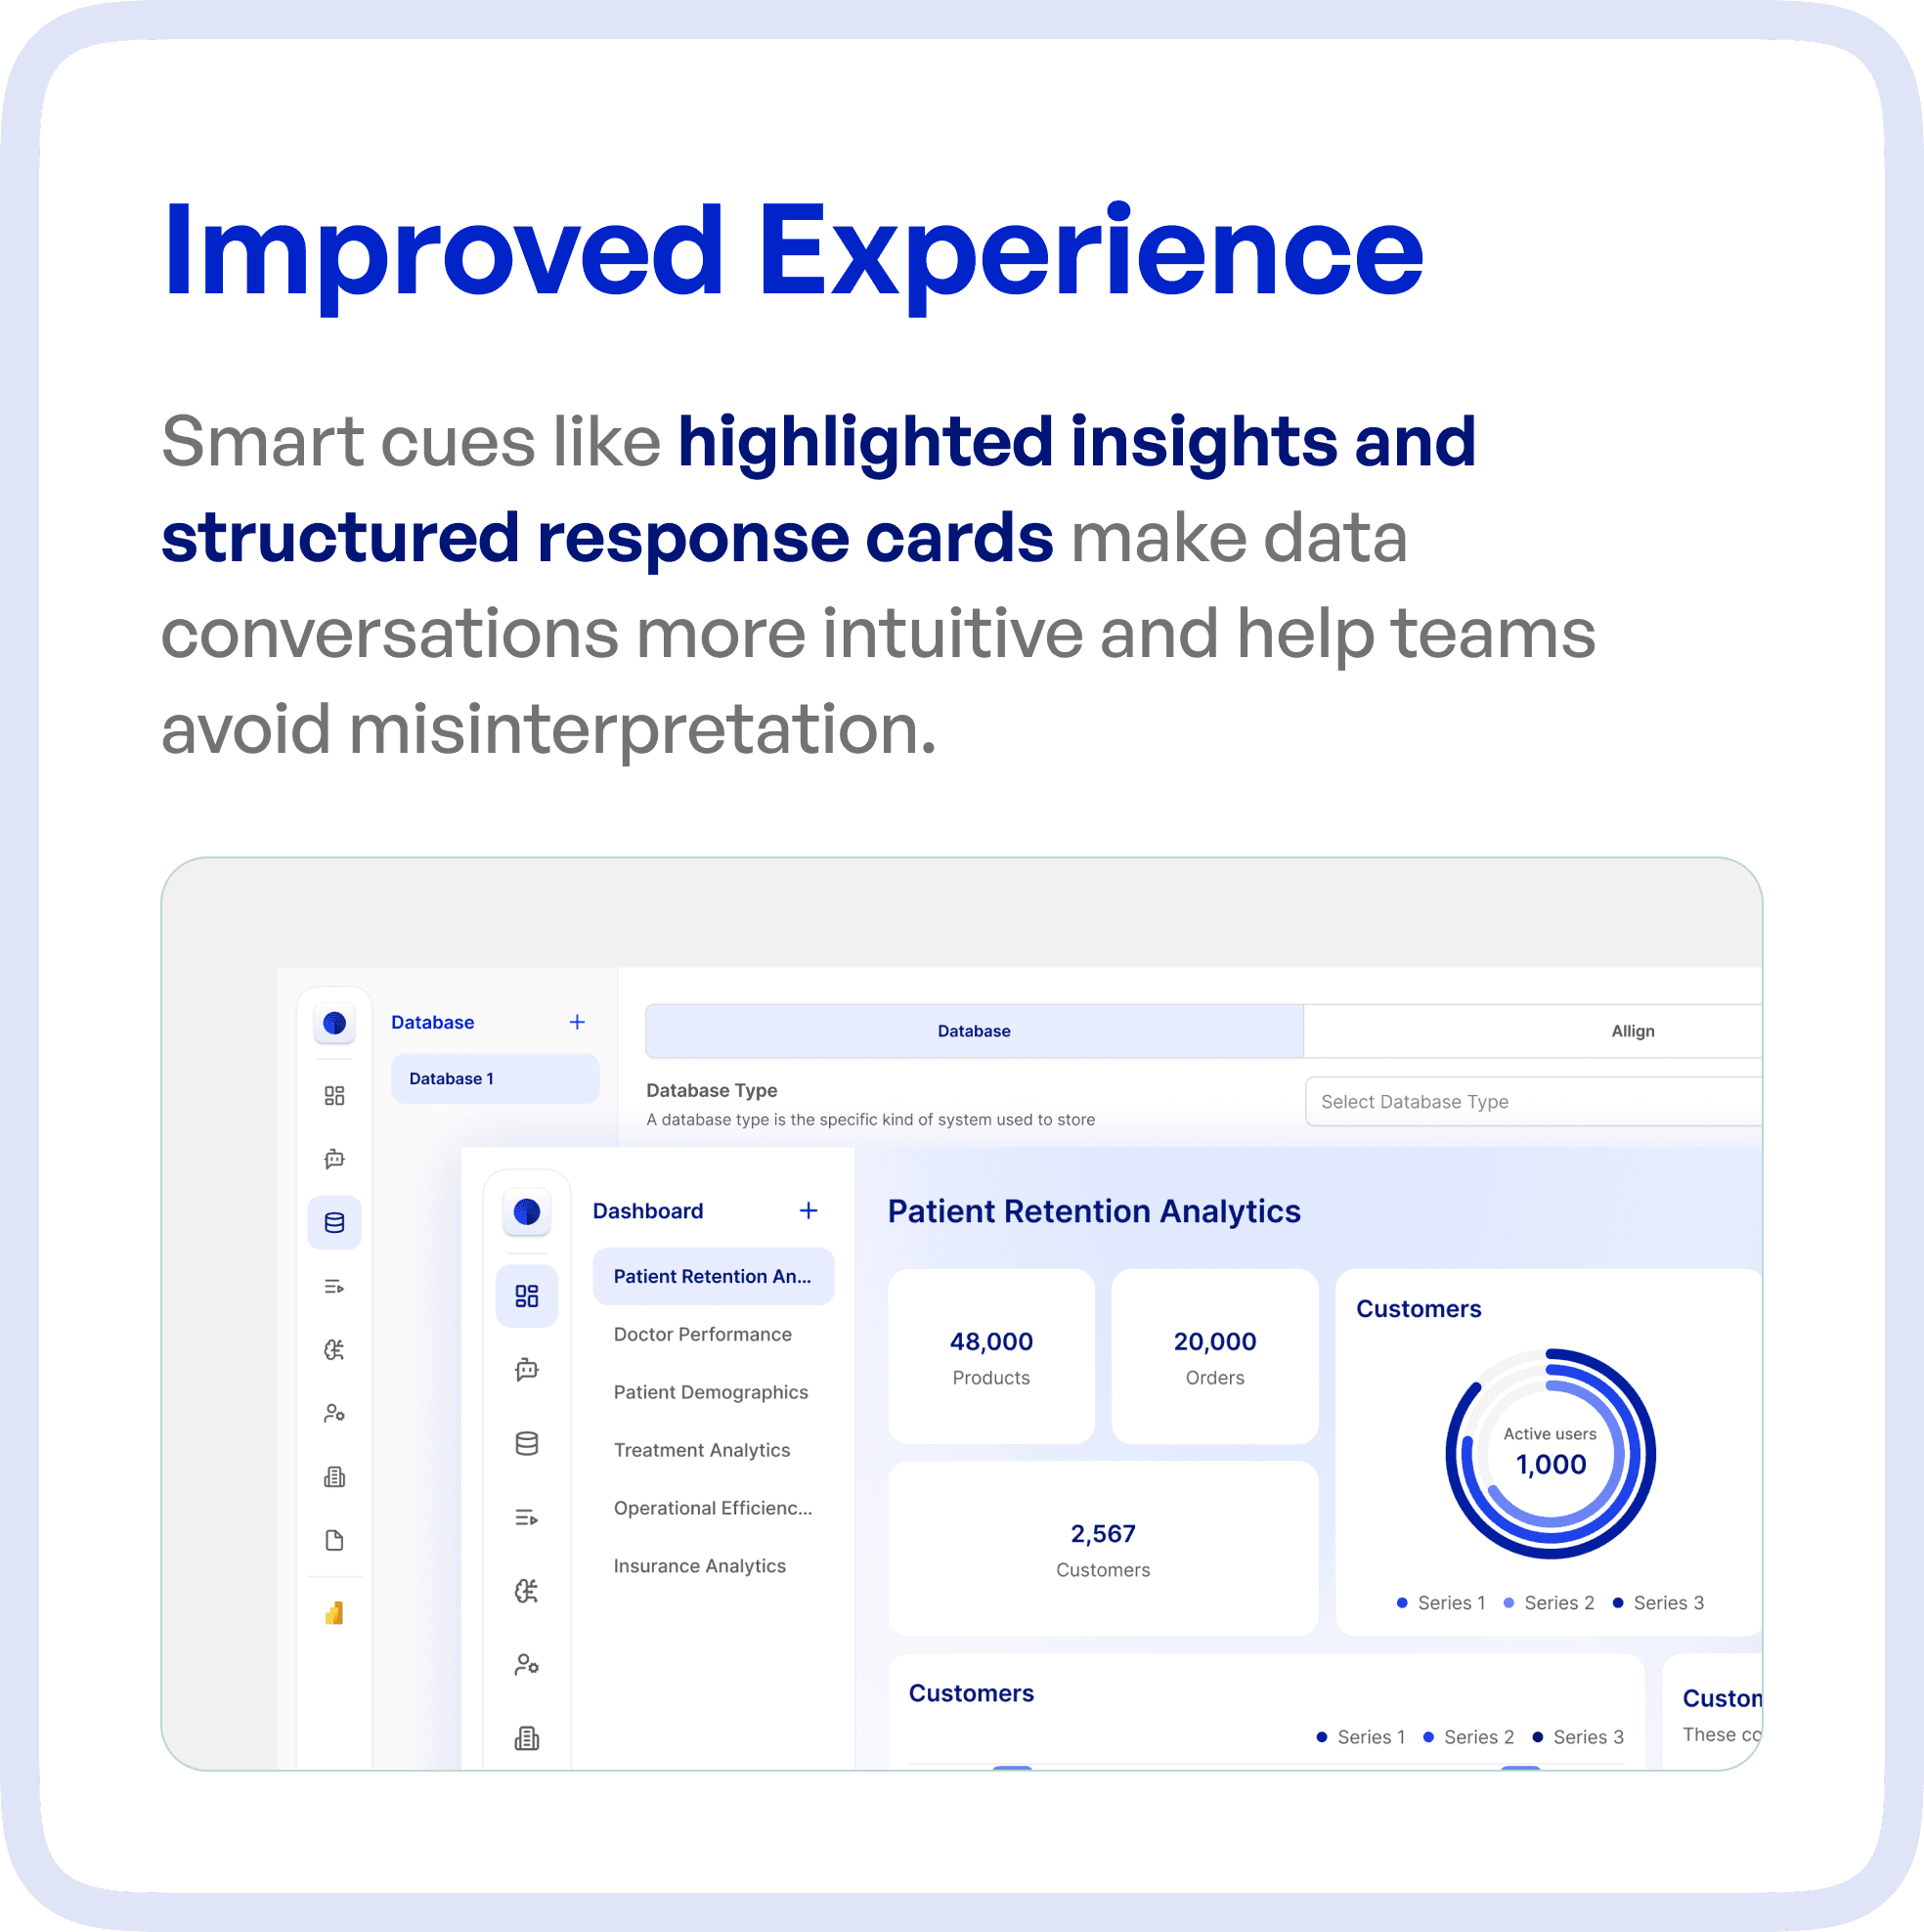
To improve usability, we redesigned key screens with a focus on readability and prioritization.
Key improvements:
Prioritized key metrics to reduce cognitive load
Grouped related actions logically
Improved readability of data-heavy screens
Added contextual indicators for better understanding
This made insights easier to consume and act upon.
Improving AI Interaction with Structured Responses
AI-generated responses were redesigned to be more structured and usable.
Enhancements included:
Highlighted key insights
Structured response cards
Improved content hierarchy
This reduced misinterpretation and made conversations more actionable.
The Result: A Clear and Reliable Data Experience
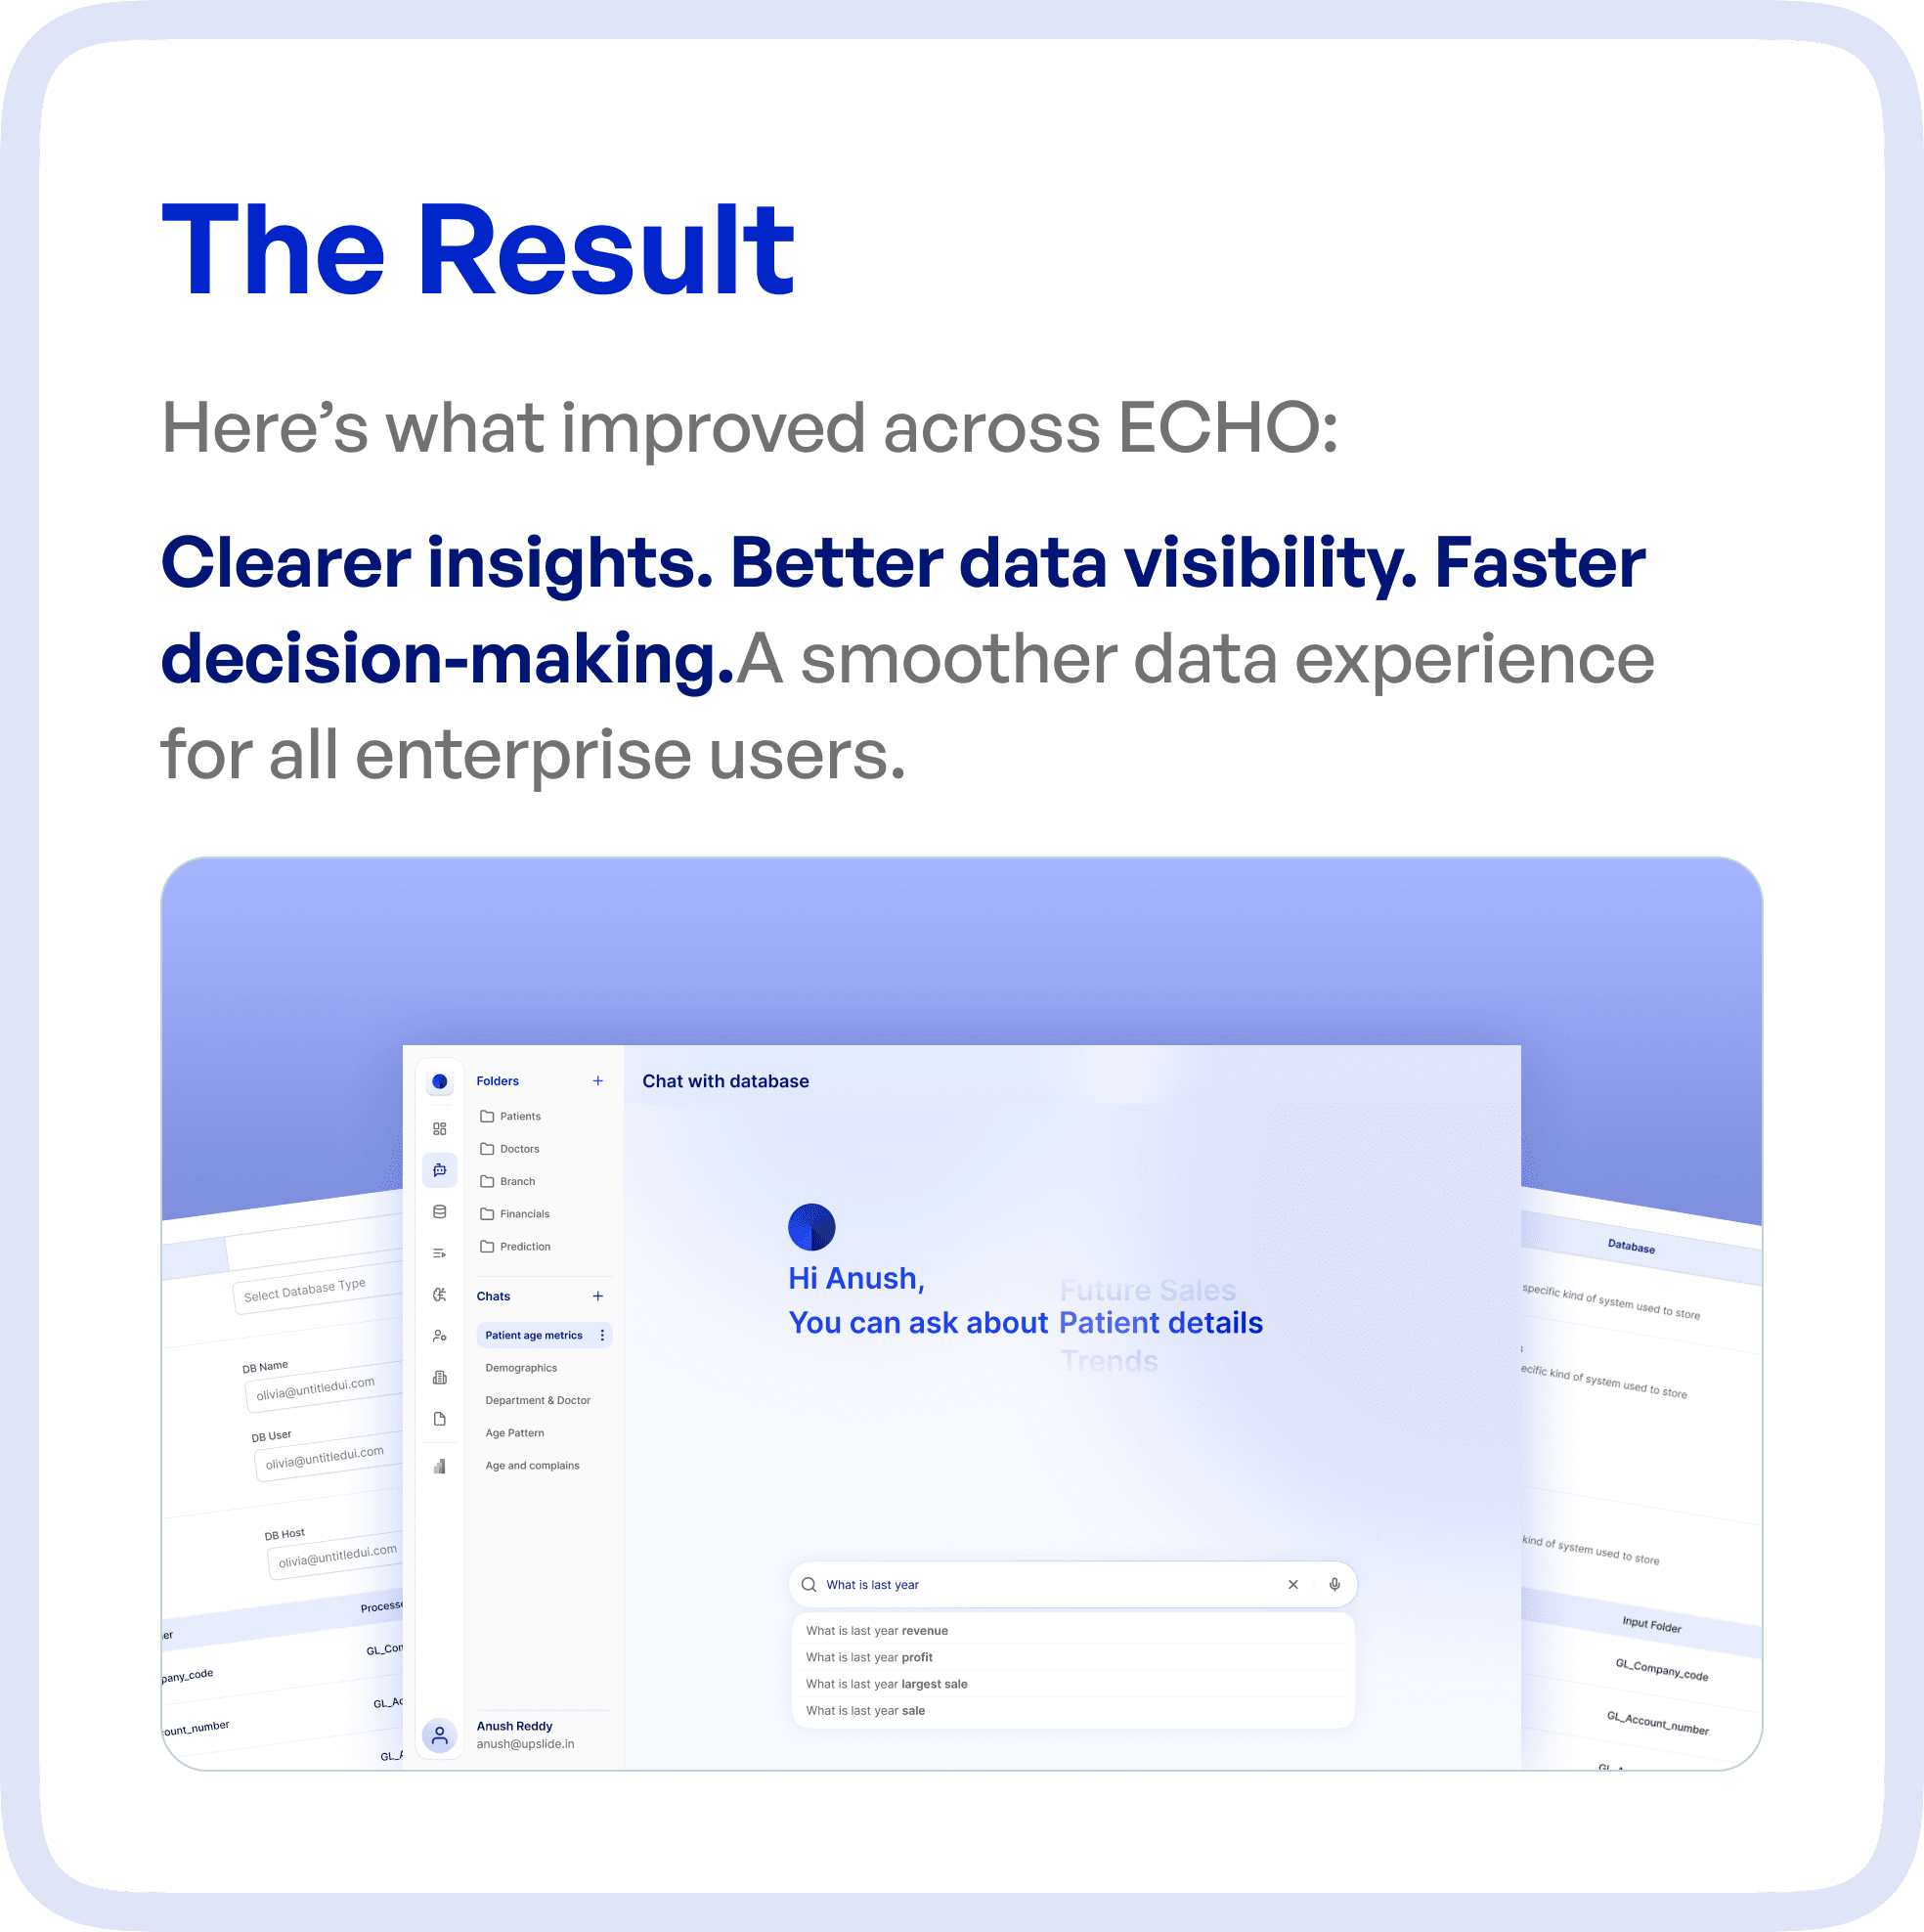
After the redesign, ECHO transformed into a more intuitive and efficient platform.
Key outcomes:
Clearer insights
Improved data visibility
Faster decision-making
Increased trust in the system
Users can now:
Quickly find relevant information
Understand AI responses with ease
Act on insights confidently
Why UX is Critical in AI and Data Platforms
AI platforms are only valuable if users can:
Understand outputs
Trust the system
Take action based on insights
Without strong UX:
Insights remain unused
Confusion increases
Adoption drops
With structured UX:
Data becomes actionable
Workflows become efficient
User confidence improves
Final Thoughts
The challenge in AI platforms is not generating insights.
It is making those insights clear, accessible, and usable.
By structuring data flows and improving interaction design, organizations can unlock the true value of their AI systems.
Frequently asked questions
How can an AI data interface make outputs easier to evaluate?
Connect outputs to the relevant inputs or evidence, distinguish processing states and make uncertainty or missing data visible. Provide a clear route to inspect, correct or escalate a result. A polished chart alone does not establish that an AI output is accurate.
How should an AI data platform handle missing data or failed processing?
Distinguish an empty dataset, a processing failure and an output that requires review. Explain what the user can change or retry, while preserving relevant inputs. Avoid showing a confident-looking result when the system cannot support one.

